
The Nine Numbers: Max Profit, POP, Margin and More
The builder shows nine metrics for every strategy. Learn to read all of them: breakevens, max profit and loss, probability of profit, risk to reward, net credit or debit, estimated premium, total P&L, and the margin the trade blocks.
- ·Breakeven points
- ·Max profit and max loss
- ·Probability of profit (POP)
- ·Risk to reward
- ·Net credit vs net debit
- ·Estimated premium and margin
Almost every strategy in this course comes with a panel of numbers sitting right beside its chart. The OpenAlgo builder reports nine of them, and together they are the full scorecard of a trade. The chart shows you the shape; these nine numbers put exact figures on it. Learn to read all nine and you can size a position, judge its odds, and know precisely how much cash it ties up, all before you place a single order. This chapter teaches every one of them, using a real NIFTY trade you will meet again later, the bull put spread, and then sets it beside a very different trade so the most important lesson lands.
The nine numbers on the panel
Here is the full panel the builder shows for any strategy. We will define each, then read them off a real trade.
- Max Profit: the best the position can do at expiry, per lot.
- Max Loss: the worst it can do at expiry, per lot. "Unlimited" means the loss keeps growing as the underlying keeps moving against you. In the strict sense that is only the upside of a naked short call or a short future, because price has no ceiling above. A short put or a long future loses on the downside, but that loss is bounded, since price cannot fall below zero, so it is very large rather than truly infinite. A bought option, call or put, can never lose more than the premium you paid for it. When the builder prints "Unlimited", read it as "no ceiling on this side", and always pair it with the realistic move that would actually hurt.
- Breakevens: the price or prices where the orange expiry line crosses zero.
- Probability of Profit (POP): the market-implied odds the trade ends in profit.
- Risk to Reward: max profit set against max loss, shown as 1 to something.
- Net Credit or Net Debit: whether you receive premium up front (credit) or pay it (debit).
- Est. Premium: the gross premium of all the legs added together, a turnover figure.
- Total P&L: the open profit or loss right now, about zero the moment you enter.
- Margin Req.: the margin (in cash or pledged collateral) the exchange blocks to hold the position.
Nine numbers describe a trade in full: max profit, max loss, breakevens, probability of profit, risk to reward, net credit or debit, estimated premium, live total P&L, and margin required. The chart is the picture; these nine are the exact figures behind it.
The bull put spread, in numbers
The bull put spread is a mildly bullish, defined-risk credit trade with two legs, both puts, on the 28 July 2026 expiry.
| Leg | Action | Strike | Type |
|---|---|---|---|
| 1 | Sell | 24,050 | Put |
| 2 | Buy | 23,950 | Put |
You sell the 24,050 put, which pays you as long as NIFTY holds up, and buy the 23,950 put below it as protection. The sold put brings in more than the bought put costs, so you walk away with a net credit. Here is the full nine-number panel.
| Metric | Value |
|---|---|
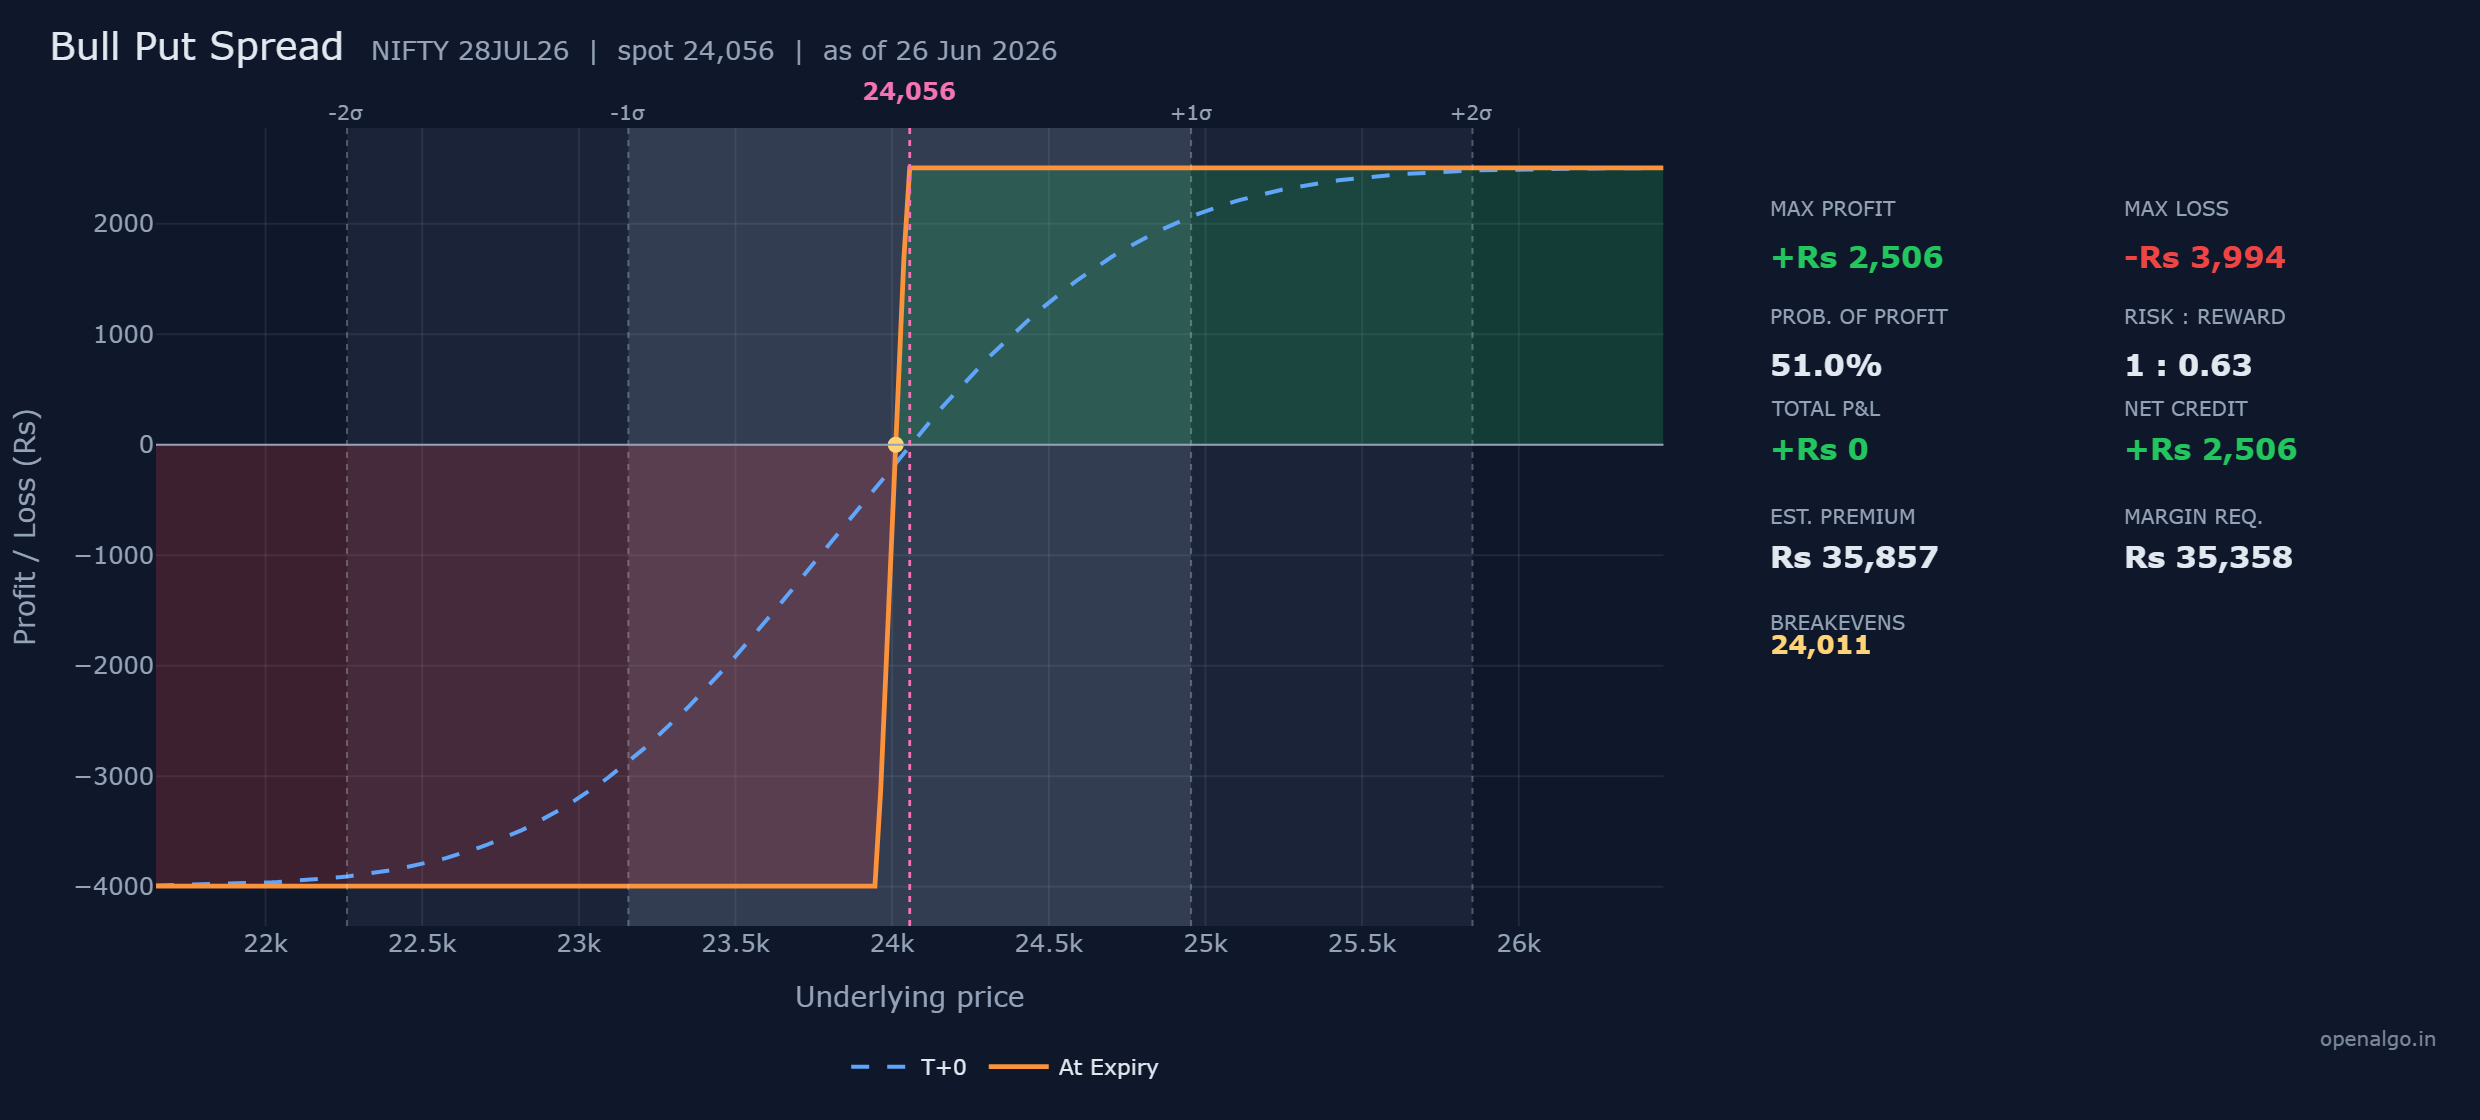
| Breakeven | 24,011 |
| Max Profit | Rs 2,506 |
| Max Loss | Rs 3,994 |
| Probability of Profit | 51 percent |
| Risk to Reward | 1 : 0.63 |
| Net Credit | Rs 2,506 |
| Est. Premium | the gross premium of both puts combined |
| Total P&L | about Rs 0 at entry |
| Margin Req. | Rs 35,358 |
Walking the numbers one by one
Max profit, Rs 2,506. This is exactly the net credit you collected, and you keep all of it if NIFTY closes at or above 24,050, where both puts expire worthless. The credit is the reward, and you bank it just by NIFTY not falling.
Max loss, Rs 3,994. This is suffered if NIFTY closes at or below 23,950, where the bought put caps the damage. The two strikes are 100 points apart, worth Rs 6,500 for the lot of 65. You kept Rs 2,506 as credit, so the most you can lose is the rest, Rs 6,500 minus Rs 2,506, which is Rs 3,994. Credit plus max loss always equals the full strike width.
Breakeven, 24,011. NIFTY can drift down a little, all the way to 24,011, and you still come out even, because the credit cushions the first part of any fall. That is the 24,050 strike minus the credit of about 39 points a share. Above 24,011 you keep at least some profit, below it you start to lose.
Net credit, Rs 2,506. The position pays you on day one. A credit means premium lands in your account up front, the mark of a net seller. A debit would mean you paid up front, the mark of a net buyer. Here the credit and the max profit are the same figure, which is true of every simple credit spread.
Risk to reward, 1 to 0.63. For every rupee you risk you can make about 63 paise. You are risking Rs 3,994 to make Rs 2,506, so you risk more than you can make. That is not a flaw, it is the trade-off you accept in return for a higher chance of winning, which the next number explains.
Est. premium. This is the gross premium of both puts added together, a turnover figure, not your risk. Do not confuse it with the maximum loss. Your real risk is the Rs 3,994 max loss, never the gross premium.
Total P&L, about zero. The moment you enter, the position is worth roughly what you paid or received, so the open profit or loss is near zero. It moves into the green or the red as NIFTY travels and as time decays.
Margin required, Rs 35,358. This is the margin (in cash or pledged collateral) the exchange blocks to let you hold the trade, the SPAN plus exposure margin from the OpenAlgo margin calculator. Because this is a defined-risk spread with a bought protective put, the margin is modest. A naked short put with the same view would block several times more.
For this bull put spread the strikes are 100 points apart, worth Rs 6,500 for the lot of 65. The credit of Rs 2,506 is your reward, and the remaining Rs 3,994 is your risk. Credit plus max loss always equals the full strike width. Every figure on the panel is per one lot.
Probability of profit, and the trade it implies
The number a beginner most often misreads is probability of profit, the POP. It is the market-implied chance the trade finishes in profit, worked out from a model of where NIFTY might land by 28 July, using the at-the-money implied volatility of about 12.7 percent and the days to expiry. You do not need the formula. Read it as the odds the trade ends a winner.
For the bull put spread the POP is 51 percent. NIFTY only has to hold near or above 24,011, slightly below today's 24,056, so the trade wins a little more than half the time. Pair that with the risk to reward of 1 to 0.63 and the full picture appears: a roughly even chance of winning, with a reward a little smaller than the risk. That is a balanced, honest trade, which is why it makes a good first credit spread.
Here is the rule that governs almost every strategy you will meet.
A high probability of profit usually comes with a small reward, and a large reward usually comes with a low probability of profit. The market prices these so that no shape is free money. When a trade wins often, each win tends to be small; when a trade pays big, it tends to win rarely.
A high-POP trade: the short iron condor
To feel that trade-off, set the bull put spread beside a four-legged defined-risk structure you will meet later, the short iron condor. Ignore its construction for now and just read its numbers against the spread you already know.
| Metric | Bull Put Spread | Short Iron Condor |
|---|---|---|
| Max Profit | Rs 2,506 | Rs 884 |
| Max Loss | Rs 3,994 | Rs 5,616 |
| Probability of Profit | 51 percent | 83 percent |
| Risk to Reward | 1 : 0.63 | 1 : 0.16 |
| Breakevens | 24,011 | 23,864 / 24,236 |
| Margin Req. | Rs 35,358 | Rs 68,864 |
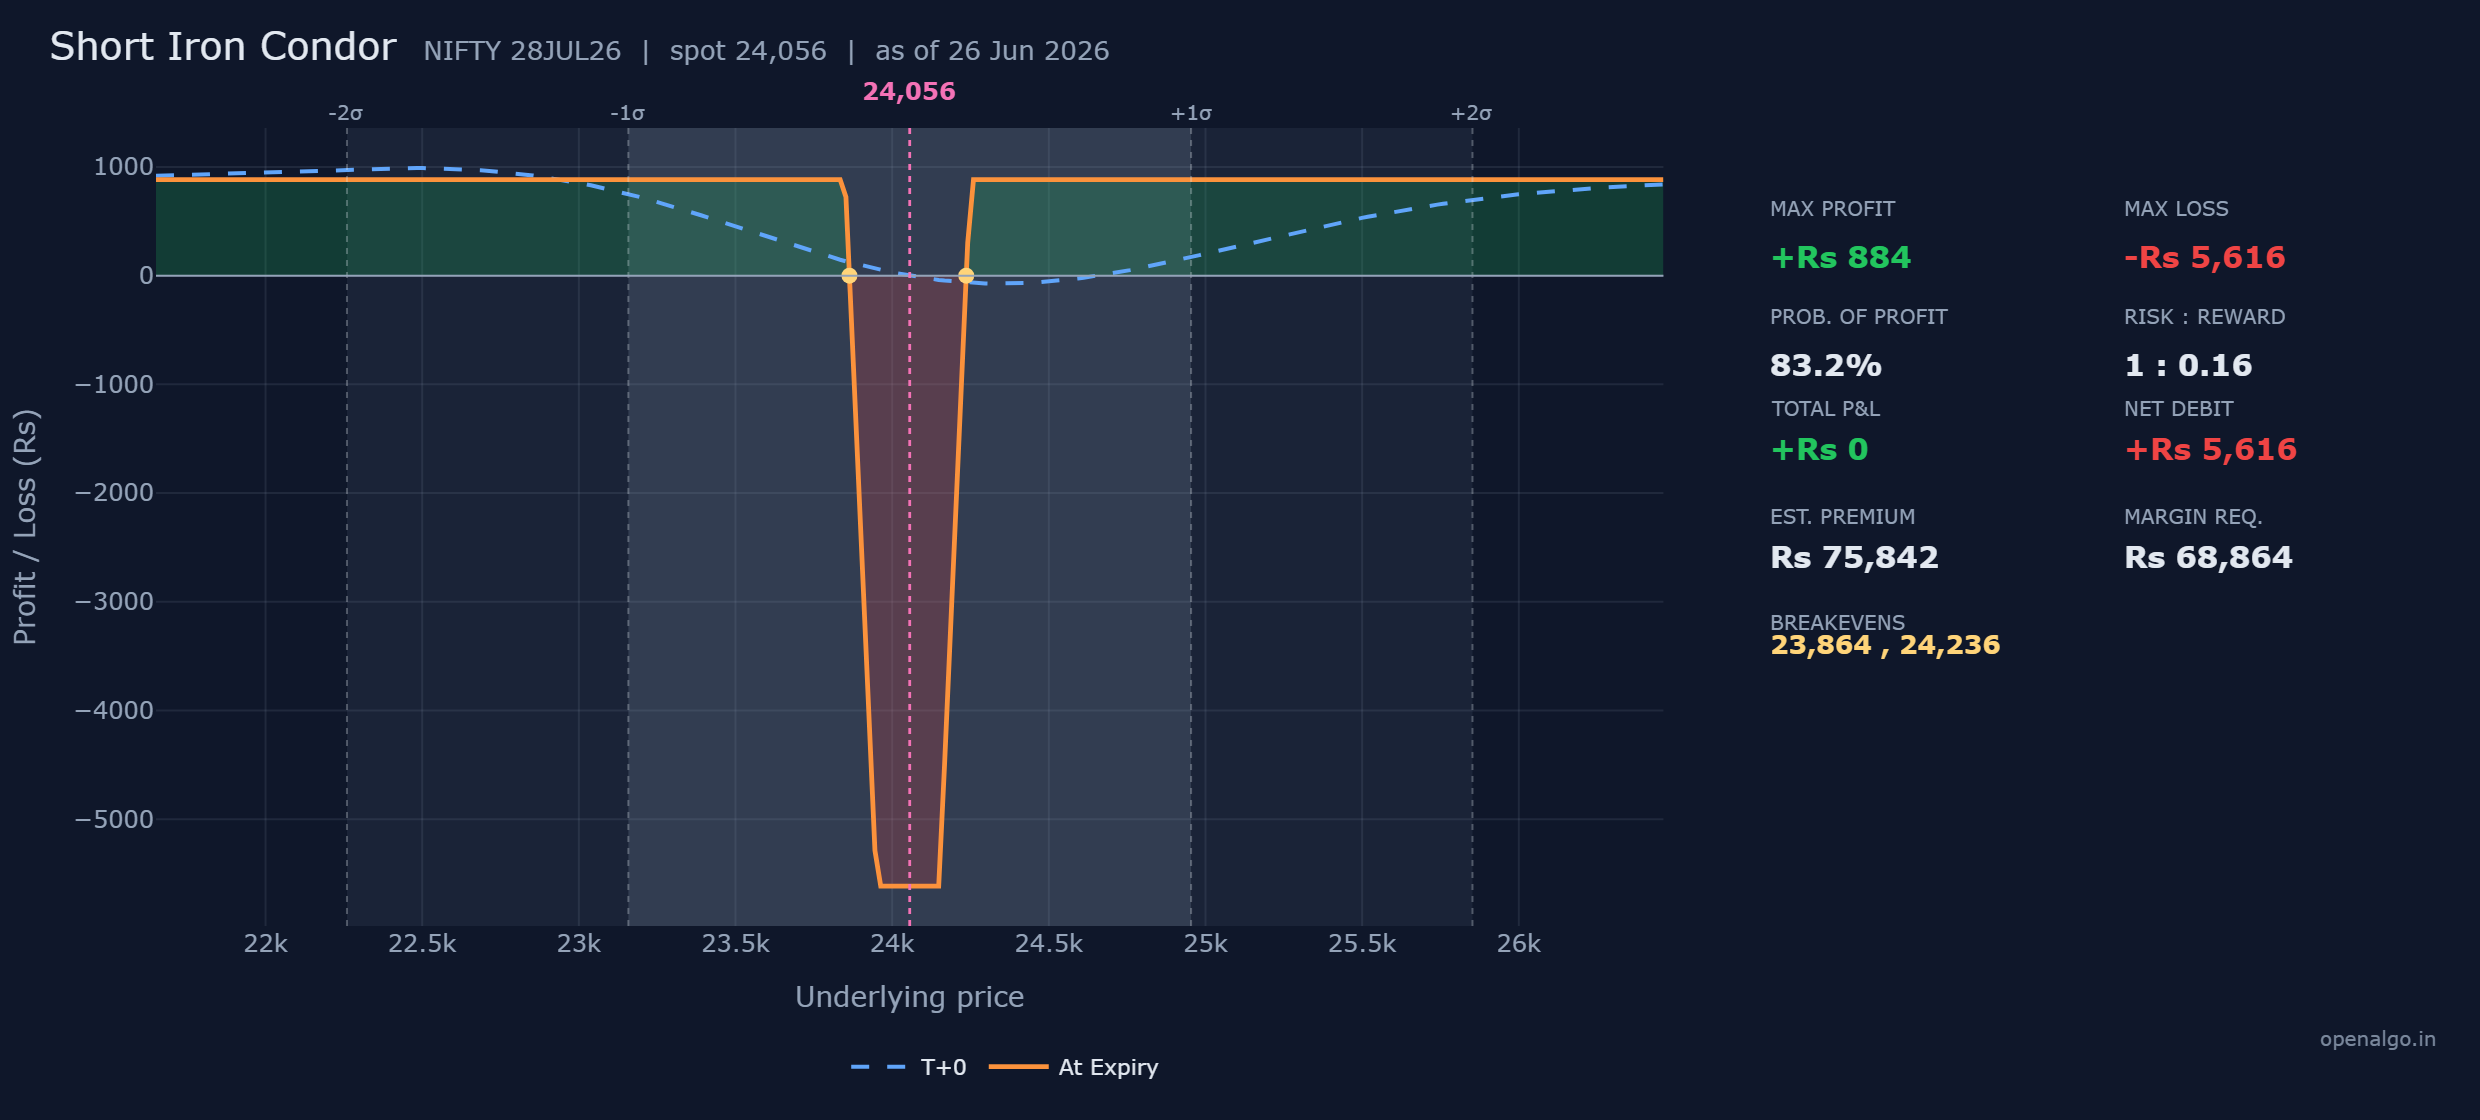
The short iron condor wins 83 percent of the time, far more often than the bull put spread. That sounds wonderful until you read the rest of the panel. Each win is only Rs 884, while each loss can be Rs 5,616, a risk to reward of just 1 to 0.16. You are risking more than six rupees to make one. The high win rate and the small reward are two sides of the same coin: the market hands you the frequent wins only because it makes each one small and the rare loss large.
This is the single most important lesson in reading the panel. A high POP is not the same as a good trade, and a poor risk to reward is not the same as a bad one. The two numbers must always be read together, alongside your own honest view of where NIFTY is likely to go. Either trade can be sensible in the right conditions, and either can hurt you if you size it carelessly.
Never judge a strategy by its POP alone or its risk to reward alone. Read them as a pair. An 83 percent POP with a 1 to 0.16 reward and a 51 percent POP with a 1 to 0.63 reward are simply two different bargains, not a better one and a worse one. Your view on NIFTY decides which bargain fits.
Margin and defined risk, for beginners
Two of the nine numbers protect you more than the rest, the max loss and the margin required. Together they tell you what a trade can cost and what it ties up while it is open.
Both of these examples are defined-risk. The max loss is a flat, finite floor printed on the chart, Rs 3,994 for the bull put spread and Rs 5,616 for the short iron condor, because a bought leg caps the damage on each side. Their margins, Rs 35,358 and Rs 68,864, are modest for the same reason. Compare that to the naked short positions later in the course, where the loss is unlimited and the margin runs past a lakh and a half. As a beginner you want the trades whose worst case is a known number you can survive, and whose margin you can comfortably set aside.
Always size a position by its max loss, never by its credit or its estimated premium. The bull put spread risks Rs 3,994 to make Rs 2,506, and a string of wins does not shrink the next loss. Decide your lot count by what your account can absorb on a bad day, keep every protective leg in place, and treat the margin figure as real cash that is locked away while the trade is open.
You now own the full scorecard. From here, every chapter introduces a strategy by its shape and its nine numbers, and you already know how to read all of them. Next we put them to work on the simplest trades of all, the single-leg long call and short put.