
Call and Put Ratio Spreads
Strategies with an unequal number of legs. Learn the call ratio spread and the put ratio spread, where selling extra options funds the trade but opens unlimited risk on one side, with the metrics.
- ·Unequal legs explained
- ·The call ratio spread
- ·The put ratio spread
- ·Where the naked risk hides
- ·Credit vs debit versions
- ·Reading the real payoffs
The ratio back spreads from earlier chapters bought more options than they sold, so they opened for a debit, kept a defined loss, and paid off only on a big, fast move. This chapter turns that ratio on its head. Now you sell more than you buy. You collect a fat credit upfront, you profit most if NIFTY drifts gently toward the strike you sold, and you carry one naked option that can run away if the index moves too far the wrong way. These are the call ratio spread and the put ratio spread. They look clever, they often win, but the uncapped side is real, so read both charts with your eyes open.
The one-line idea
A ratio spread buys one option at the money and sells two of the same type a little further out. Because you sold one more than you bought, the position leans net short beyond the sold strike, which is exactly where the danger lives. It is a credit trade that wants NIFTY to drift toward the strike you sold and stop there, paying its peak right on that strike.
A ratio spread sells two options and buys one, opening for a credit. It profits across a wide zone, peaks exactly at the sold strike, and then exposes a single naked option beyond it. The credit you collect is the reward for carrying that uncapped tail.
The real trade, rupee by rupee
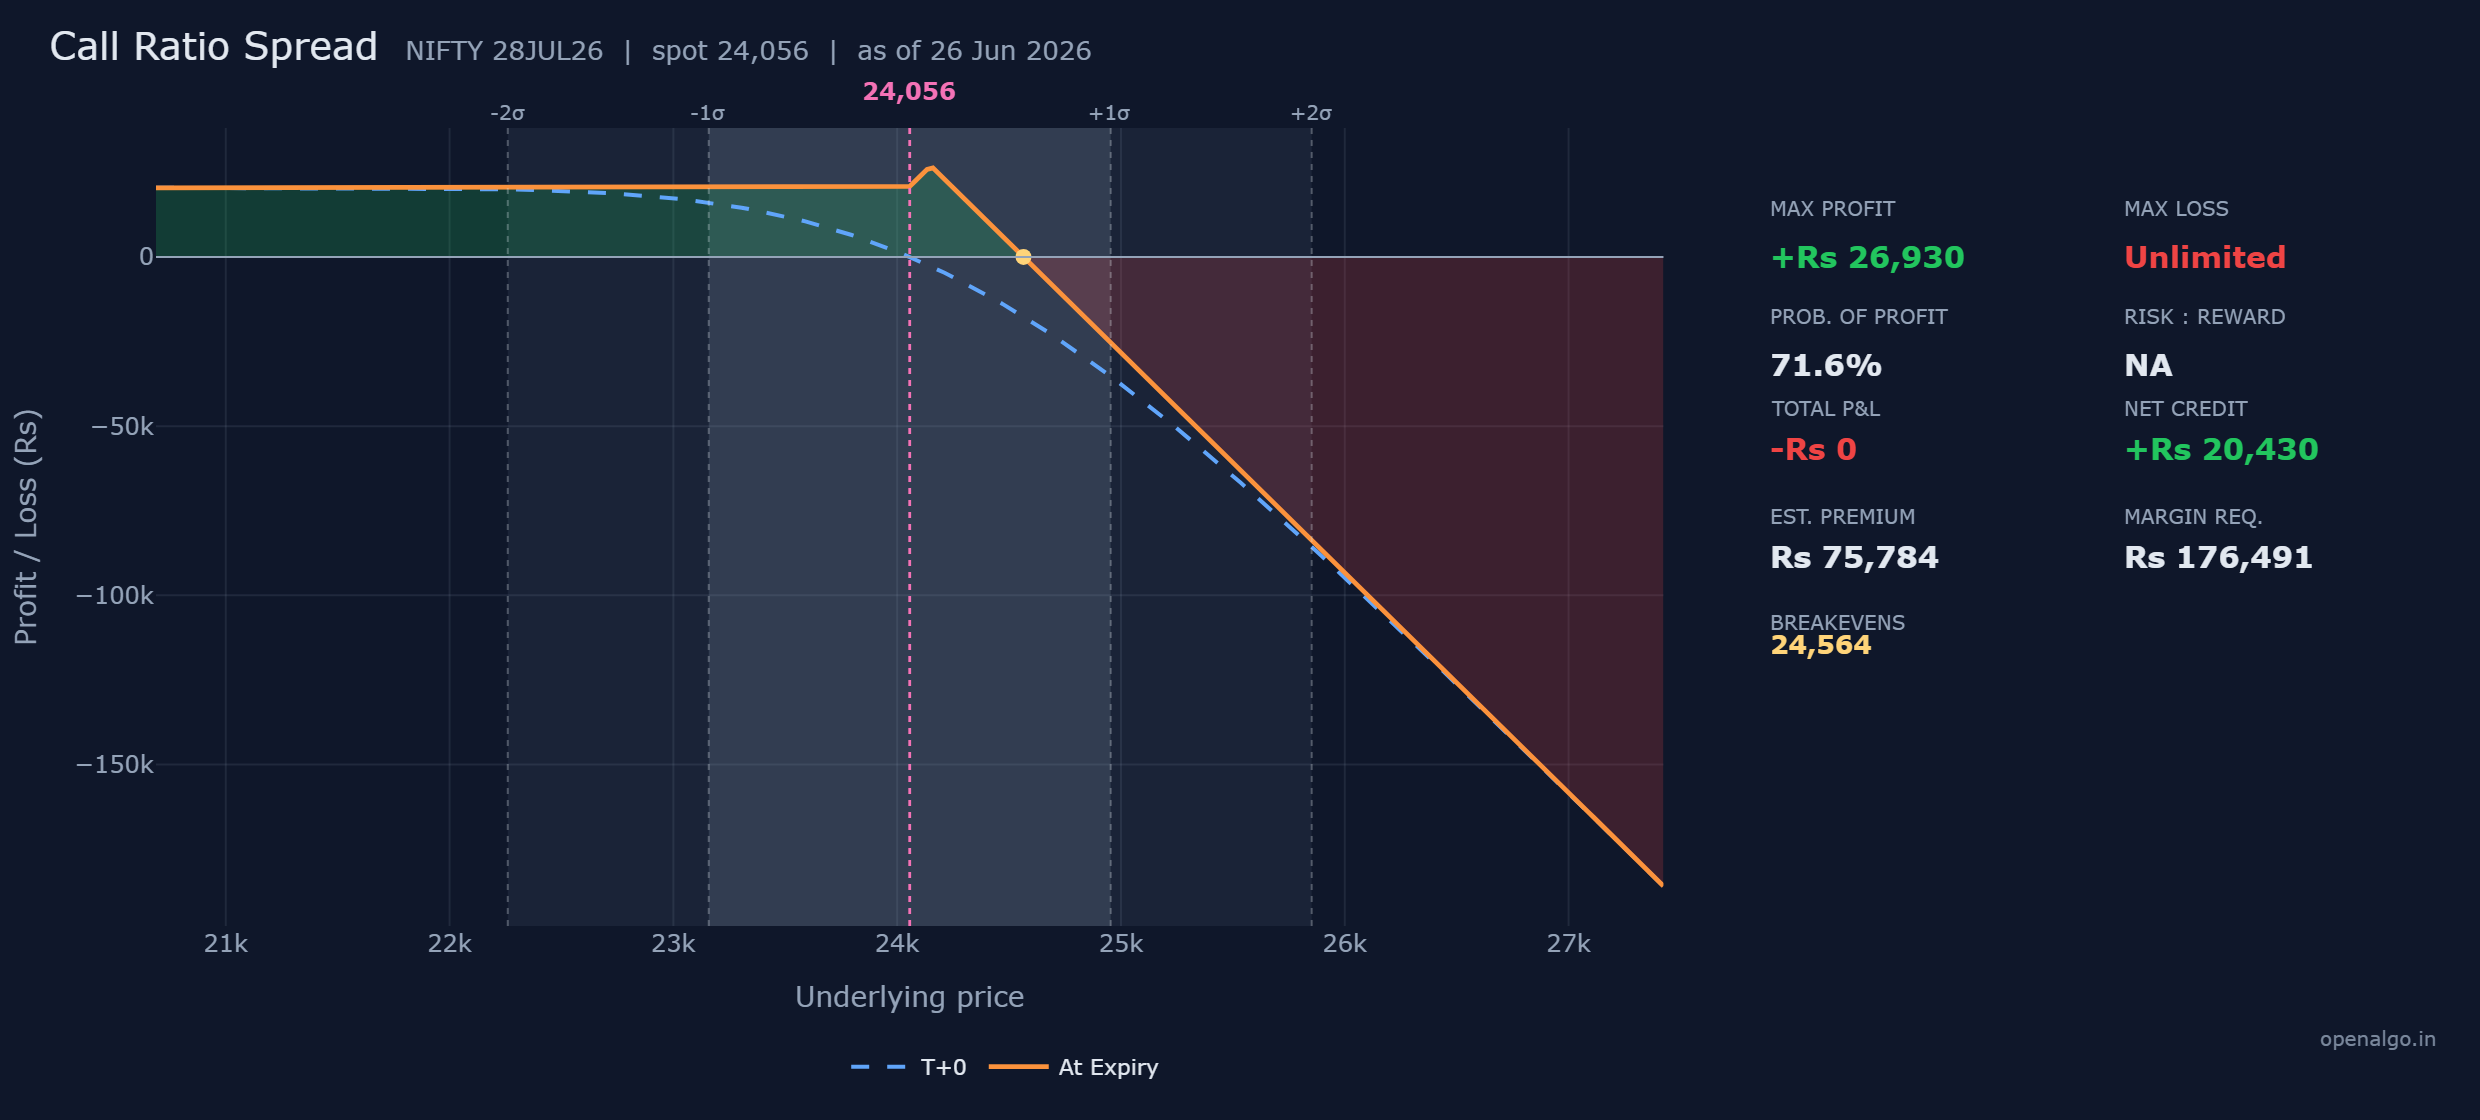
Here is the call ratio spread on real NIFTY prices, captured on 26 June 2026 with the index at 24,056 and the 28 July 2026 expiry about 32 days away. You buy one at-the-money 24,050 call and sell two 24,150 calls one strike higher.
| Leg | Action | Strike | Premium per share | Cash flow per lot of 65 |
|---|---|---|---|---|
| 1 | Buy call | 24,050 | 425.8 paid | Rs 27,677 out |
| 2 | Sell call (x2) | 24,150 | 370.1 received | plus Rs 48,107 in |
| Net credit | plus Rs 20,430 in |
You pay Rs 27,677 for the one bought call and take in Rs 48,107 for the two sold calls, so the position opens for a healthy net credit of Rs 20,430. That credit is yours to keep if NIFTY simply stays at or below 24,050, where every call expires worthless.
The three numbers, and where they come from
Maximum profit is Rs 26,930, reached at the sold strike. As NIFTY rises from 24,050 toward 24,150, your bought call gains value while the two sold calls are still worthless, so profit climbs. At exactly 24,150 the bought call is worth a full hundred points, Rs 6,500, on top of the credit you already hold. So the peak is 20,430 plus 6,500, which is Rs 26,930.
Maximum loss is unlimited. Push past 24,150 and the two sold calls wake up against you. You are now short one net call, losing 65 rupees a point with no ceiling. This is the naked tail, and it never stops.
Breakeven is 24,564. Above 24,150 your single net short call gives back 65 rupees a point from the Rs 26,930 peak. The peak is worth about 414 points of cushion per share, so the at-expiry line crosses zero 414 points above 24,150, at 24,564.
| Number | How it is built | This trade |
|---|---|---|
| Max profit | credit plus the bought call at the sold strike | Rs 20,430 plus Rs 6,500 = Rs 26,930 |
| Max loss | the naked extra short call above the peak | unlimited |
| Breakeven | sold strike plus the peak cushion per share | 24,150 plus 414 = 24,564 |
Walking the outcomes at expiry
Settle the trade at five closing prices and watch the ramp, the peak, and the cliff. A call is worth max(NIFTY minus strike, 0) per share, and the net is per lot of 65.
| NIFTY at expiry | Long 24,050 CE (you own) | Two short 24,150 CE (you owe) | Net P&L per lot |
|---|---|---|---|
| 23,950 | 0 | 0 | plus Rs 20,430 (credit floor) |
| 24,050 | 0 | 0 | plus Rs 20,430 |
| 24,150 | 100 | 0 | plus Rs 26,930 (peak) |
| 24,564 | 514 | 828 | about Rs 0 (breakeven) |
| 24,700 | 650 | 1,100 | minus Rs 8,820 (loss grows) |
Below 24,050 the line sits flat on the Rs 20,430 credit floor. From there it ramps up to the Rs 26,930 peak at 24,150, then turns down as the second short call bites, crossing zero at 24,564 and falling without floor beyond. At 24,700 you are already down Rs 8,820, and every further point costs another 65 rupees.
A call ratio spread has a maximum loss that is unlimited. The extra sold 24,150 call is naked, so once NIFTY climbs past the breakeven of 24,564 you lose 65 rupees for every point it keeps rising, with no ceiling at all. The exchange blocks about Rs 1.76 lakh of margin precisely because of that uncapped tail. The comfortable probability of profit comes from the wide cushion before the loss starts, but a strong rally past the peak can turn a string of wins into one large loss.
Your odds
The probability of profit is 72 percent. That high number comes from the wide cushion: NIFTY can sit anywhere below the 24,564 breakeven and you finish in the green, and most of the time over 32 days it does. Look at the chart and the breakeven sits well outside the upper sigma band, the move the market expects. The trade wins often precisely because the danger only begins after a large rally.
Read the 72 percent probability of profit next to the word unlimited, never alone. A high win rate attached to an uncapped tail is the classic trap: it pays you steadily for months, then a single sharp rally hands back far more than you ever collected. If you are still learning, prefer the defined-risk relatives, or cap the naked side with a far bought call before you place the trade.
Margin and return on margin
Because of the naked tail, the exchange blocks a heavy margin of about Rs 1,76,491, many times what a defined spread of similar size would need. That large number is the exchange telling you in cash that this structure is dangerous, even though it opened for a credit that felt like free money.
On return on margin, the Rs 26,930 peak against Rs 1,76,491 blocked is about 15 percent, but that is the best case at the exact sold strike, not a number you can count on, and it ignores the unlimited downside. Always weight the peak by the odds and the tail before quoting it as a yield.
Time decay
This is a net short position, you sold two options and bought one, so on balance time decay works for you. Look at the chart: the blue dashed T+0 line sits below the orange at-expiry peak, and every calm day lifts the position toward that peak as the sold time value melts. The catch is that decay helps only while NIFTY behaves. Once the index pushes past the peak, time stops mattering and the naked call drives the loss.
The put ratio spread
The put ratio spread is the same idea pointed downward. You buy one at-the-money put and sell two puts a little lower, leaving you net short one put below the lower strike.
| Leg | Action | Strike | Premium per share | Cash flow per lot of 65 |
|---|---|---|---|---|
| 1 | Buy put | 24,050 | 295.1 paid | Rs 19,182 out |
| 2 | Sell put (x2) | 23,950 | 256.6 received | plus Rs 33,352 in |
| Net credit | plus Rs 14,170 in |
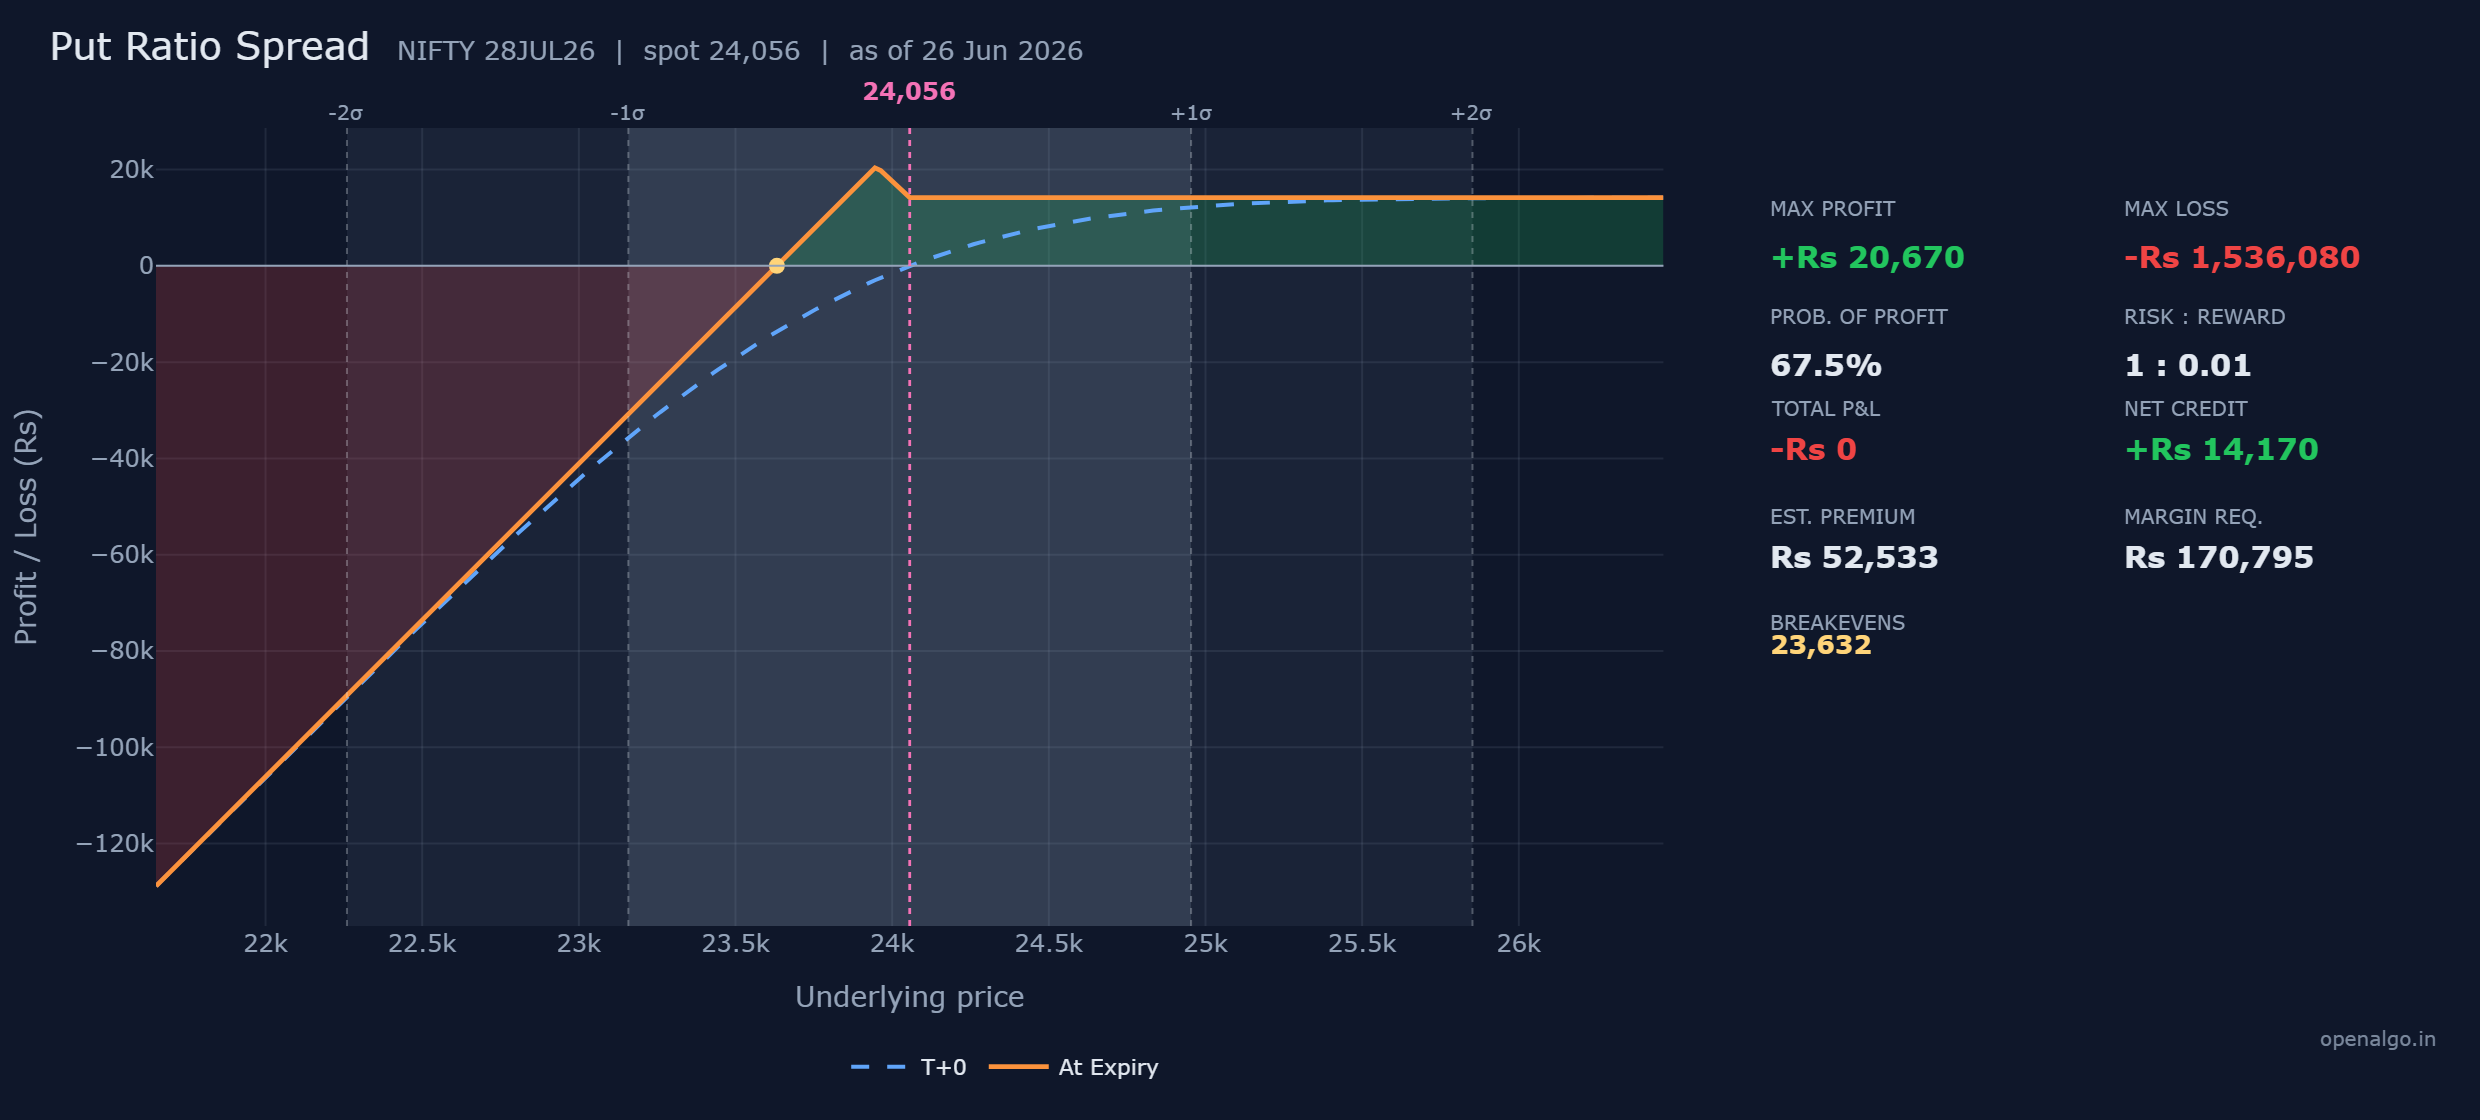
You pay Rs 19,182 for the one bought put and collect Rs 33,352 for the two sold puts, opening for a net credit of Rs 14,170, kept in full if NIFTY stays at or above 24,050. The peak sits at the lower strike: as NIFTY falls toward 23,950, the bought put gains while the sold puts stay worthless, lifting profit to its maximum of Rs 20,670 when NIFTY pins 23,950. Below that the two sold puts turn against you, you are net short one put, and the breakeven is 23,632.
| NIFTY at expiry | Long 24,050 PE (you own) | Two short 23,950 PE (you owe) | Net P&L per lot |
|---|---|---|---|
| 24,100 | 0 | 0 | plus Rs 14,170 (credit floor) |
| 24,050 | 0 | 0 | plus Rs 14,170 |
| 23,950 | 100 | 0 | plus Rs 20,670 (peak) |
| 23,632 | 418 | 636 | about Rs 0 (breakeven) |
| 23,500 | 550 | 900 | minus Rs 8,580 (loss grows) |
The shape mirrors the call version. The line is flat on the Rs 14,170 floor above 24,050, ramps to the Rs 20,670 peak at 23,950, crosses zero at 23,632, and deepens below. The probability of profit is 68 percent, and the margin is about Rs 1,70,795.
A put ratio spread carries a very large downside loss, listed as about Rs 15.4 lakh if NIFTY fell toward zero. The extra sold 23,950 put is naked to the downside, so once NIFTY breaks below 23,632 you lose 65 rupees a point with only the floor of zero stopping it. That is why the exchange blocks about Rs 1.71 lakh of margin. The 68 percent probability of profit reflects the wide cushion above, not the depth of the tail. A sharp fall is exactly what hurts this trade most.
How a ratio spread differs from a back spread
It is easy to confuse these credit ratio spreads with the debit ratio back spreads from earlier. They are near opposites, and the difference is which side you over-weight.
- A back spread buys two and sells one, so it is net long. It pays a small debit, keeps a defined loss, and needs a big, fast move to pay off.
- A ratio spread sells two and buys one, so it is net short. It collects a credit, peaks if NIFTY pins the sold strike, and exposes a naked tail beyond it.
The back spread wants violence and accepts a low win rate for a huge payoff. The ratio spread wants a mild, steady drift toward the sold strike and accepts a naked tail for a high win rate. Same legs, opposite ratio, opposite character.
Compare the margins. Both ratio spreads block well over Rs 1.7 lakh, while the back spreads from earlier chapters blocked only about Rs 46,000 to Rs 52,000. The exchange is telling you in cash that the naked tail of a ratio spread is the more dangerous structure, even though it opens for a credit that feels like easy money.
Key takeaways
- A ratio spread buys one option and sells two of the same type, opening for a credit and peaking exactly at the sold strike.
- The call ratio spread collects Rs 20,430, peaks at Rs 26,930 on 24,150, breaks even at 24,564, and then carries an unlimited loss above from the naked extra call.
- The put ratio spread collects Rs 14,170, peaks at Rs 20,670 on 23,950, breaks even at 23,632, and carries a very large downside loss below from the naked extra put.
- Both wear a high probability of profit, 72 and 68 percent, because the danger only begins after a large move, but the win rate sits next to an uncapped tail, so never size by the credit.
- The heavy margin near Rs 1.7 lakh is the exchange pricing the naked leg. A ratio spread is the opposite of a back spread: net short, credit, and dangerous on a strong move.
- Build both in sandbox trading (analyzer mode in OpenAlgo), then drag the modelled price out past the breakeven and watch the at-expiry line fall away with no floor. That sight is the whole lesson of a naked tail.