
The Bull Put Spread
A bullish trade that pays you a credit upfront. Learn how selling a put and buying a lower one collects premium while capping the risk, and how it profits if NIFTY simply does not fall.
- ·A bullish, premium-collecting view
- ·Sell a put, buy a lower put
- ·The net credit
- ·Defined maximum loss
- ·Probability of profit
- ·Reading the real payoff
Most beginners meet options as a lottery ticket. You pay a small premium, you pray for a big move, and most days the ticket expires worthless. The bull put spread flips that script entirely. Here you are the one selling the ticket, collecting the premium, and quietly keeping it as long as NIFTY simply does not fall. You are not betting on a rally. You are betting against a crash, which is a very different and often far easier bet to win. This chapter builds the trade on real NIFTY prices, shows you exactly where every rupee comes from, and gives you the three dimensions that most explainers leave out: the odds, the margin, and the way time itself works in your favour.
The one-line idea
A bull put spread is two put options on the same expiry. You sell a higher-strike put to collect a fat premium, and you buy a lower-strike put as cheap insurance against a real crash. You keep the difference as a net credit, and that credit is the most you can make. Because the bought put caps your downside, the most you can lose is fixed and known before you ever click the button.
You use it when your view is moderately bullish, meaning you think NIFTY will rise, stay flat, or at worst fall only a little. You do not need a rally. You only need NIFTY to avoid falling hard.
A bull put spread sells a higher put and buys a lower put for a net credit. You profit if NIFTY stays above your higher strike, you lose only if it falls below your lower strike, and both the profit and the loss are capped. It is a bet that the market will not crash, not a bet that it will soar.
The real trade, rupee by rupee
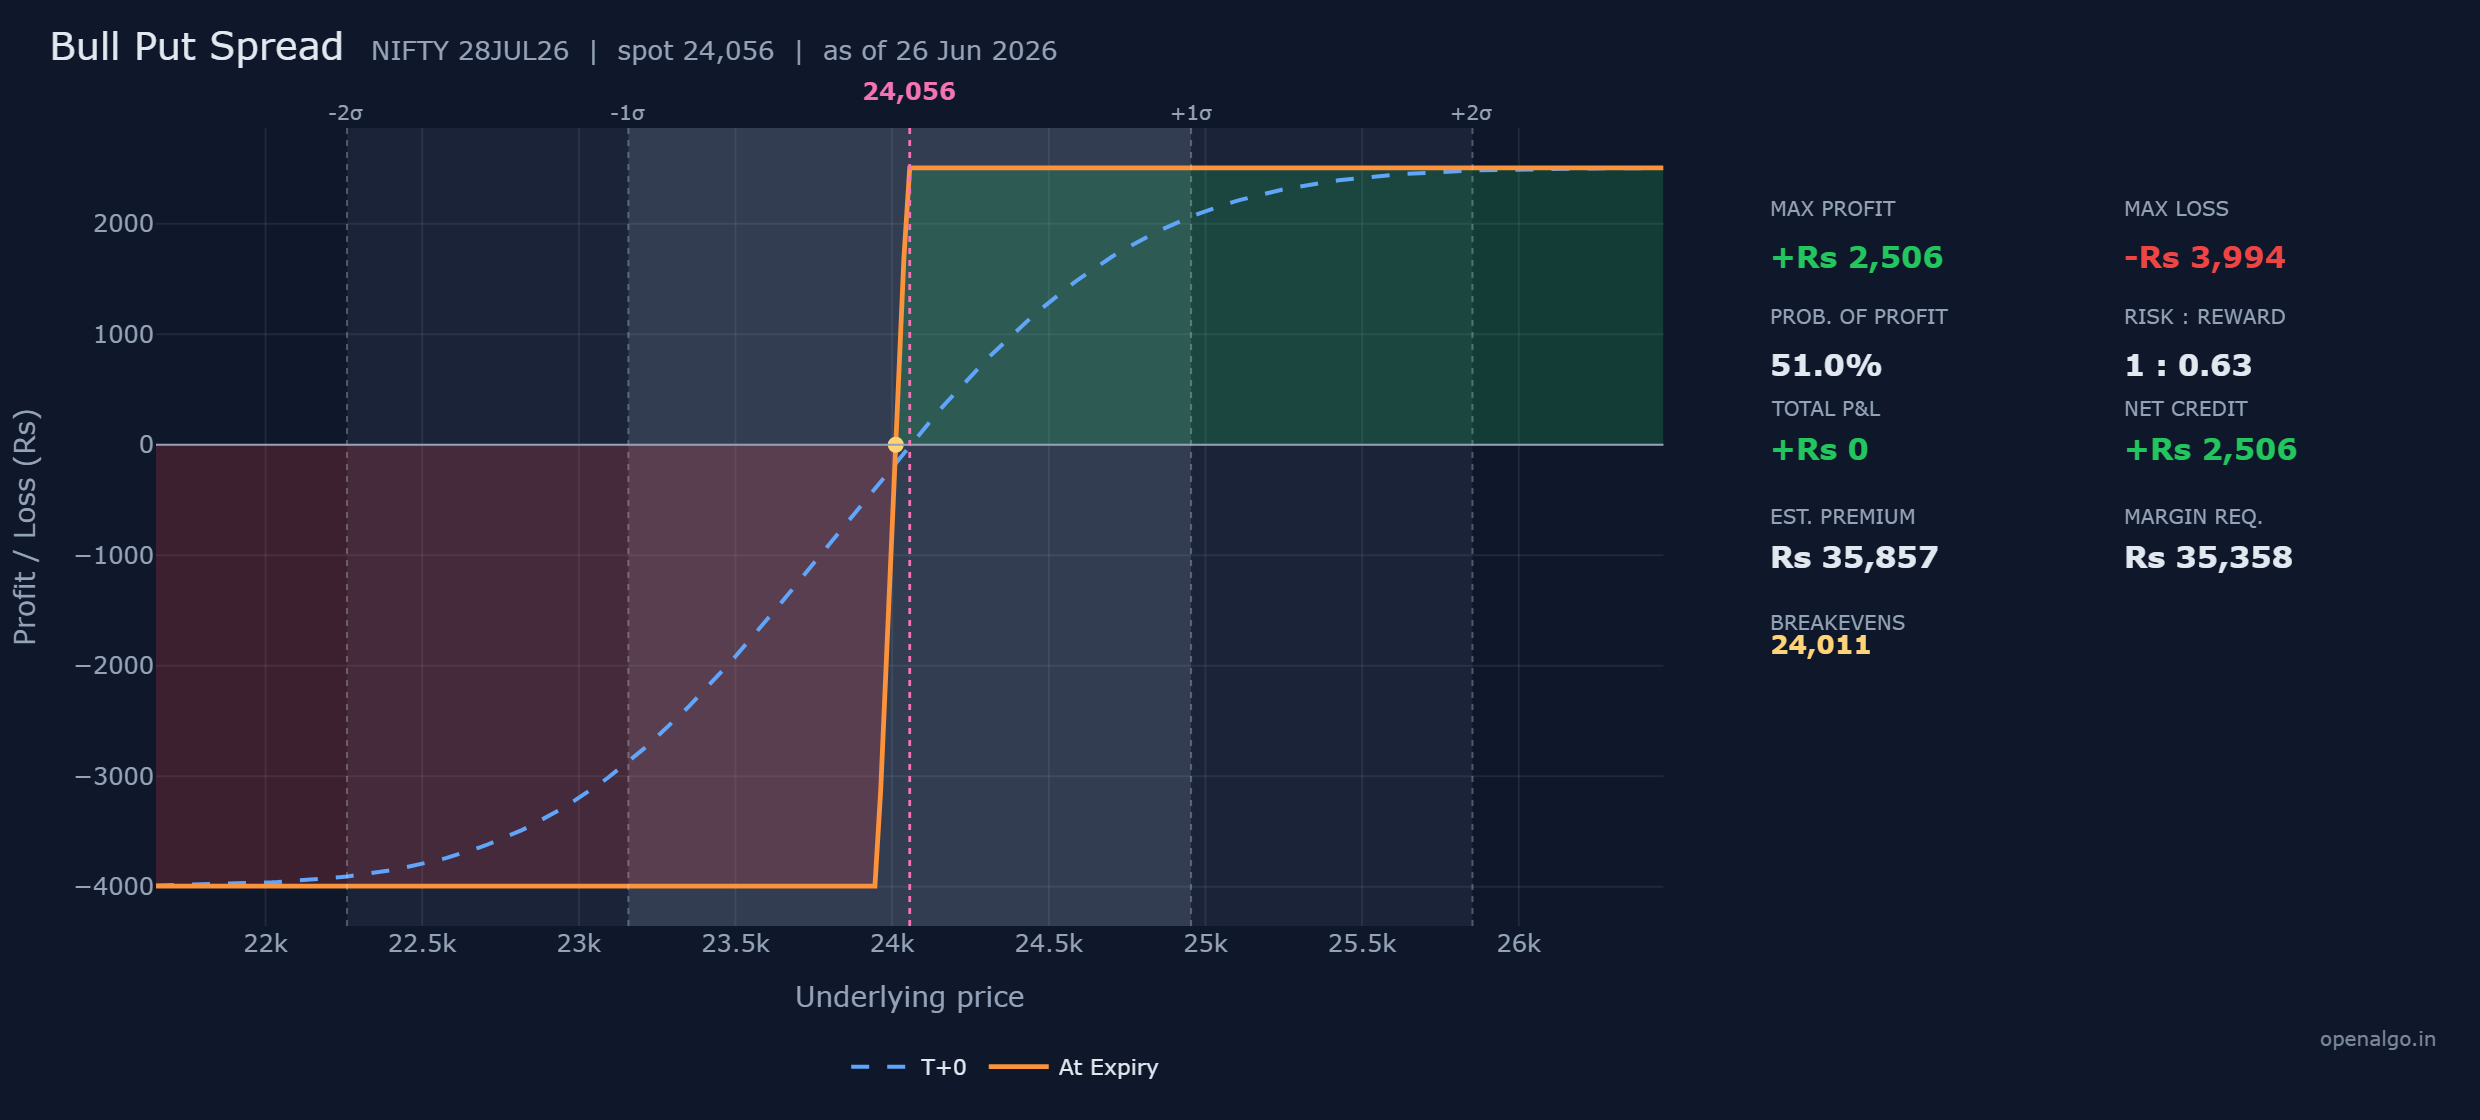
Here is the exact trade on real NIFTY prices, captured on 26 June 2026 with the index at 24,056 and the 28 July 2026 expiry about 32 days away. We sell the at-the-money 24,050 put and buy the 23,950 put one strike below.
| Leg | Action | Strike | Premium per share | Cash flow per lot of 65 |
|---|---|---|---|---|
| 1 | Sell put | 24,050 | 295 received | plus Rs 19,175 in |
| 2 | Buy put | 23,950 | 257 paid | Rs 16,669 out |
| Net credit | plus Rs 2,506 in |
The premium you receive for the 24,050 put is larger than the premium you pay for the 23,950 put, because the higher strike is worth more. That gap is your net credit of Rs 2,506, and it lands in your account the moment you open the trade. This is why the bull put spread is called a credit spread.
The three numbers, and where they come from
Every bull put spread is described by three numbers, and each one falls straight out of the trade above. No memorising required once you see the logic.
Maximum profit is the net credit, Rs 2,506. If NIFTY finishes anywhere at or above the 24,050 strike, both puts expire worthless. Nobody exercises a put when the index is above the strike. You owe nothing, you keep the full credit, and that is the best the trade can do.
Maximum loss is the spread minus the credit, Rs 3,994. The spread is the gap between the two strikes, 100 points, worth 100 times 65, which is Rs 6,500. If NIFTY collapses below 23,950, both puts are deep in the money and the full 100-point gap between them is locked in against you. You lose that Rs 6,500, but you already pocketed Rs 2,506, so your real loss is 6,500 minus 2,506, which is Rs 3,994. The bought put is what stops the loss growing past this. Without it you would be a naked seller facing a fall of lakhs.
Breakeven is the higher strike minus the credit per share, 24,011. You collected 38.55 points of credit per share. NIFTY can drift 38.55 points below the 24,050 strike, to 24,011, before the loss on your short put eats the whole credit. Above 24,011 you finish in profit. Below it you finish in loss.
| Number | How it is built | This trade |
|---|---|---|
| Max profit | net credit | Rs 2,506 |
| Max loss | spread minus net credit | Rs 6,500 minus Rs 2,506 = Rs 3,994 |
| Breakeven | higher strike minus credit per share | 24,050 minus 38.55 = 24,011 |
Walking the outcomes at expiry
The cleanest way to trust a strategy is to settle it at a handful of closing prices and watch the money. Here is the bull put spread at five levels of NIFTY on expiry day, per lot of 65.
| NIFTY at expiry | 24,050 put you sold | 23,950 put you bought | Net profit or loss |
|---|---|---|---|
| 23,800 | worth 250 | worth 150 | minus Rs 3,994 (max loss) |
| 23,950 | worth 100 | worth 0 | minus Rs 3,994 (max loss) |
| 24,011 | worth 39 | worth 0 | Rs 0 (breakeven) |
| 24,050 | worth 0 | worth 0 | plus Rs 2,506 (max profit) |
| 24,300 | worth 0 | worth 0 | plus Rs 2,506 (max profit) |
Read down the table and the shape of the trade appears on its own. Anywhere from 24,050 upward you collect the full Rs 2,506. Anywhere from 23,950 downward you lose the full Rs 3,994. Between the two strikes the result slides smoothly from one shelf to the other, passing through zero at 24,011. That is the entire payoff, and it matches the orange line on the chart exactly.
The dimension most explainers skip: your odds
Knowing the most you can win and lose is only half the story. The question that actually decides whether a trade is smart is, how likely is each outcome? That is the probability of profit, or POP, and the builder puts it right on the panel.
For this spread the POP is about 51 percent. That number comes from the option market itself. Using the volatility priced into NIFTY options, roughly 12.7 percent, and the 32 days left, the market implies a 51 percent chance that NIFTY finishes above the 24,011 breakeven by expiry. Look at the chart again. The faint shaded sigma bands show the move the market expects, and the breakeven at 24,011 sits just below the spot, comfortably inside the inner band. NIFTY does not need to do anything special. It only needs to hold roughly where it already is.
Always read the max loss next to the POP, never alone. This spread risks Rs 3,994 to make Rs 2,506, a worse than one-to-one payout, yet it still makes sense because the odds, 51 percent, lean your way and time helps you. A credit spread is a deal where you accept a smaller reward in exchange for winning more often. The POP is how you check that the trade-off is genuinely in your favour.
The other dimension most explainers skip: margin
Because you are a net seller, the exchange blocks margin as security, here about Rs 35,358, made of a SPAN component plus an exposure buffer. The bought 23,950 put is what keeps this number small. Without it the naked short put would tie up over Rs 1.6 lakh. The protective leg does not just cap your loss, it slashes the capital the trade needs.
That margin lets you judge the trade honestly through return on margin. You collect Rs 2,506 against Rs 35,358 blocked for about a month, which is roughly 7 percent on the capital at risk if the trade works. That is the real yield of the position, and it is the number a serious trader compares across ideas, not the raw premium.
Time is on your side
Look once more at the chart, at the blue dashed T+0 line sitting above the solid orange at-expiry line near the current price. That gap is time value, and for a net seller it is a gift. Every calm day a little of the premium in the options you are short melts away, and the blue line sinks toward the orange one. You collected the credit up front, and time quietly converts it into realised profit as long as NIFTY behaves. A long option buyer fights this decay every single day. As a credit-spread seller, you are paid by it.
Choosing your strikes
The 100-point spread above is one choice among many. Widen or narrow the gap between the strikes and you reshape the whole trade. Here are four real bull put spreads on the same NIFTY, same expiry, so you can see the trade-off cleanly.
| Spread | Sell / Buy | Credit (max profit) | Max loss | Breakeven | POP | Margin | Return on margin |
|---|---|---|---|---|---|---|---|
| 50 points | sell 24,050 / buy 24,000 | Rs 1,173 | Rs 2,077 | 24,032 | 50% | Rs 33,633 | 3.5% |
| 100 points | sell 24,050 / buy 23,950 | Rs 2,506 | Rs 3,994 | 24,011 | 51% | Rs 35,358 | 7.1% |
| 200 points | sell 24,050 / buy 23,850 | Rs 4,618 | Rs 8,382 | 23,979 | 53% | Rs 39,246 | 11.8% |
| 200 points, deeper | sell 24,150 / buy 23,950 | Rs 5,372 | Rs 7,628 | 24,067 | 48% | Rs 38,553 | 13.9% |
The pattern is clear. A wider spread collects more credit and earns a higher return on margin, but it also risks more rupees if you are wrong. Selling a higher, in-the-money strike, the last row, collects the most credit of all, but it pushes the breakeven up to 24,067, above the current spot, so you now need NIFTY to actually rise a little, not merely hold. There is no free lunch in the table, only a dial you set to match your conviction. Strong moderately bullish view, widen the spread. Cautious, keep it narrow.
Bull put spread or bull call spread?
You met the bull call spread last chapter, and it expresses the very same moderately bullish view with a near-identical payoff shape. So which do you pick? The honest answer is, it depends on what the market is paying you.
- The bull call spread is a debit trade. You pay up front and hope to be right.
- The bull put spread is a credit trade. You are paid up front and hope to be left alone.
When markets have fallen, fear is high, and put premiums are swollen, selling that expensive put insurance through a bull put spread is the richer deal. When premiums are cheap and the market is calm, the bull call spread can be the better buy. Many experienced traders simply prefer the credit version, because being paid to wait, with time decay on their side, is a more comfortable way to hold a position than paying and watching the clock run against them.
A bull put spread is defined-risk, but the risk is real and it is larger than the reward. Here you risk Rs 3,994 to make Rs 2,506. A run of quiet winning months can lull you into oversizing, and then one sharp crash through your lower strike hands back several months of credits at once. Size every credit spread by its max loss, never by the credit you collect, and never sell a put spread under a level you would genuinely panic to see broken.
When it shines, and when to stay out
A bull put spread is at its best when several things line up.
- Your view is moderately bullish to neutral. You expect NIFTY to hold or rise, not to soar.
- Put premiums are rich, usually after a fall, when fear has fattened the options you want to sell.
- Implied volatility is elevated, so you are paid more to take the other side of the panic.
- There is enough time to expiry for decay to work, but not so much that the position drifts unmanaged for weeks.
Stay out when you are genuinely worried about a breakdown, when premiums are thin and there is little credit to collect, or when a major event could gap NIFTY straight through your lower strike overnight, because the defined risk only protects you at expiry, not against a violent gap that triggers an intraday margin call.
A clean way to rehearse this with no money at risk: open the OpenAlgo strategy builder, pick the bull put spread template on NIFTY, and watch the nine-metric panel update as you drag the strikes apart. See the credit and the margin rise together, watch the breakeven shift, and confirm the trade in sandbox trading (analyzer mode in OpenAlgo) before you ever fund it. Building the trade with your own hands, and seeing the same numbers this chapter quoted, is what turns a recipe into real understanding.
Key takeaways
- A bull put spread sells a higher put and buys a lower put for a net credit, profiting if NIFTY holds above the higher strike.
- Max profit is the net credit (Rs 2,506 here), max loss is the spread minus the credit (Rs 3,994), and breakeven is the higher strike minus the credit (24,011).
- The reward is smaller than the risk, so the trade earns its place through a favourable probability of profit (51 percent) and time decay working for you.
- It blocks margin (about Rs 35,358), and the bought put is what keeps that margin and the loss both small. Judge the trade by its return on margin, roughly 7 percent here.
- Wider spreads collect more credit and more return for more risk. Match the width to your conviction.
- Choose it over the bull call spread when premiums are rich and volatility is high, so you are paid well to wait.