
Event-Driven Strategies
Trading the calendar - earnings drift, index reconstitution, corporate actions and the predictable flows around scheduled events.
- ·Earnings drift
- ·Nifty index reconstitution
- ·Corporate actions
- ·Buybacks and dividends
- ·Designing event trades
- ·Event risk control
Some of the most dependable edges in markets have nothing to do with chart patterns or statistical relationships. They come from events - known dates that force certain participants to act, regardless of price. An index fund must buy a stock added to the Nifty. A company that splits its shares must adjust the price mechanically. The market must digest an earnings surprise over days, not all at once. These edges are structural, recurring, and - because the forced participant is not trying to be clever - genuinely exploitable. This chapter trades the calendar: the scheduled events you can mark in a diary months ahead. The messier flows those same participants leave behind - foreign-fund footprints, open-interest build-up, the F&O ban list, expiry-day churn - are the whole subject of the next chapter, so we keep them out of the way here.
Trading the calendar
The simplest scheduled events are plain dates. Markets show persistent calendar effects - patterns tied purely to the day or week, with no news attached. Let's measure Nifty's behaviour by weekday across years:
# Calendar effects: does the day of the week change Nifty's return and volatility?
import os
from datetime import datetime

from openalgo import api

client = api(
    api_key=os.getenv("OPENALGO_API_KEY", "your_api_key_here"),
    host=os.getenv("OPENALGO_HOST", "http://127.0.0.1:5000"),
)

end = datetime.now().strftime("%Y-%m-%d")
df = client.history(symbol="NIFTY", exchange="NSE_INDEX", interval="D",
                    start_date="2019-01-01", end_date=end)
df["ret"] = df["close"].pct_change() * 100
df["weekday"] = df.index.day_name()

order = ["Monday", "Tuesday", "Wednesday", "Thursday", "Friday"]
g = df.groupby("weekday")["ret"].agg(["mean", "std", "count"]).reindex(order)

print(f"{'DAY':11s}{'AVG RET':>10s}{'VOLATILITY':>13s}{'DAYS':>7s}")
for day in order:
    print(f"{day:11s}{g.loc[day, 'mean']:>9.3f}%{g.loc[day, 'std']:>12.2f}%{int(g.loc[day, 'count']):>7d}")

print("\nWeekly option expiry has long fallen mid-week - watch which day carries the highest volatility.")
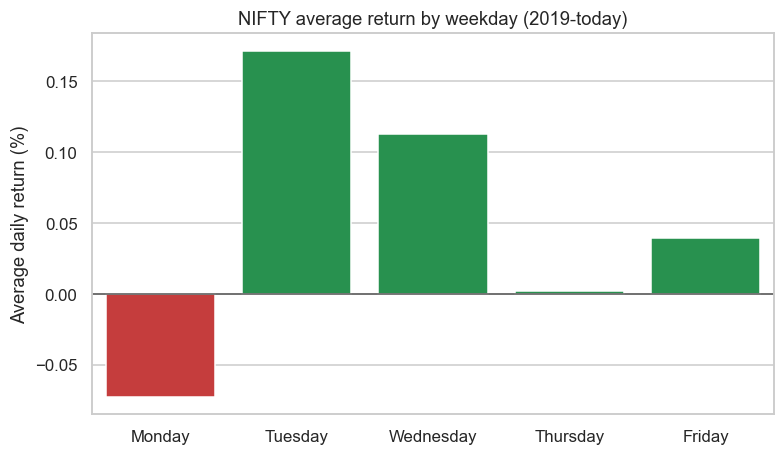
print("Persistent, calendar-driven patterns like these are the seed of event-driven strategies.")DAY AVG RET VOLATILITY DAYS Monday -0.073% 1.41% 367 Tuesday 0.172% 1.02% 371 Wednesday 0.112% 0.95% 369 Thursday 0.002% 1.03% 371 Friday 0.039% 1.04% 366 Weekly option expiry has long fallen mid-week - watch which day carries the highest volatility. Persistent, calendar-driven patterns like these are the seed of event-driven strategies.
A clear signature emerges: Monday is the weakest day (slightly negative) and the most volatile (1.4% vs about 1.0% on other days), while Tuesday is the strongest. The Monday effect has a clean story - over the weekend, news and worries accumulate with no market open to absorb them, so Monday's open gaps and churns as everything gets repriced at once. It is a small edge, easily swamped by costs on its own, but it is real, recurring, and a building block you can combine with others.
# Plot the day-of-week pattern in Nifty's average return - a calendar anomaly.
import os
from datetime import datetime
from pathlib import Path

import matplotlib

matplotlib.use("Agg")
import matplotlib.pyplot as plt
import seaborn as sns
from openalgo import api

client = api(
    api_key=os.getenv("OPENALGO_API_KEY", "your_api_key_here"),
    host=os.getenv("OPENALGO_HOST", "http://127.0.0.1:5000"),
)

end = datetime.now().strftime("%Y-%m-%d")
df = client.history(symbol="NIFTY", exchange="NSE_INDEX", interval="D",
                    start_date="2019-01-01", end_date=end)
df["ret"] = df["close"].pct_change() * 100
df["weekday"] = df.index.day_name()

order = ["Monday", "Tuesday", "Wednesday", "Thursday", "Friday"]
mean_ret = df.groupby("weekday")["ret"].mean().reindex(order)

sns.set_theme(style="whitegrid")
fig, ax = plt.subplots(figsize=(8, 4.5))
colors = ["#16a34a" if v >= 0 else "#dc2626" for v in mean_ret]
sns.barplot(x=order, y=mean_ret.values, hue=order, legend=False, palette=colors, ax=ax)
ax.axhline(0, color="#555", lw=1)
ax.set_title("NIFTY average return by weekday (2019-today)")
ax.set_ylabel("Average daily return (%)")
out = Path(__file__).with_suffix(".png")
plt.savefig(out, dpi=110, bbox_inches="tight")
best = mean_ret.idxmax()
print(f"Strongest weekday: {best} ({mean_ret.max():+.3f}%), weakest: {mean_ret.idxmin()} ({mean_ret.min():+.3f}%). Saved {out.name}")Strongest weekday: Tuesday (+0.172%), weakest: Monday (-0.073%). Saved 02_weekday_chart.png
The event-study idea
The deepest event edge is post-event drift. When genuinely new information hits - an earnings surprise, a policy change, an index inclusion - the market often under-reacts at first and then drifts in the same direction for days or weeks as the news fully sinks in:
That gradual drift after the initial jump is the edge. An event study - measuring the average price path around many past instances of the same kind of event - is how a quant discovers it, sizes it, and checks it is not just one lucky case. You line up every past instance at its event date (call it day zero), average the return on day plus one, plus two, and so on, and look for a path that bends consistently in one direction.
Drift exists because information diffuses slowly - attention is limited, funds rebalance on their own calendars, and many holders react late. The edge is largest in under-covered, hard-to-arbitrage names and shrinks as more quants crowd the same study. An edge that depends on others being slow is one you must keep re-measuring.
Post-earnings-announcement drift
The classic, best-documented event edge is post-earnings-announcement drift (PEAD): stocks that report a positive earnings surprise keep outperforming for weeks, and those that miss keep underperforming, well after the result is public. The market reprices the headline immediately on result day but is slow to fully absorb what the surprise implies for future quarters.
To trade it as a quant you first need a clean surprise measure - typically reported earnings minus the consensus estimate, scaled by the spread of analyst forecasts, or a simpler version using the size and direction of the result-day gap and volume as a proxy when estimates are not in your dataset. You then rank names by surprise, go long the strong beats and short the bad misses, and hold for a few weeks. The honest caveats are large: earnings dates and consensus numbers are an external dataset you must source and align point-in-time, the single-stock short leg runs into borrow limits and the F&O ban dynamics of the next chapter, and the drift is far weaker in heavily-covered large-caps than in the mid-cap names where attention is thin. Treat PEAD as a real but capacity-limited edge, not a money printer.
Index reconstitution
The cleanest forced-flow event in India is index reconstitution. The Nifty 50 (and the broader indices) are reviewed and rebalanced on a published schedule, with changes announced ahead of the effective date - stocks added, others dropped. The moment a stock formally joins, every index fund and ETF tracking that index is obligated to hold it at its index weight, creating a wave of predictable, price-insensitive demand on the effective day. Dropped names see the mirror-image forced selling.
Because the announcement comes before the effective date, the tradeable window is the run-up: position ahead of the index funds that must buy, then exit into their demand. It is an edge born not from insight but from obligation. The risks are equally structural - the move is well known and partly arbitraged away early, the announced list can change, and the unwind right after the effective day can be sharp once the forced buyers are done. An event study over past reconstitutions is exactly how you measure whether the run-up still pays after costs.
Corporate actions: splits, bonuses, dividends, buybacks
The corporate calendar throws off a steady stream of mechanical, modellable events:
- Stock splits and bonus issues change the share count and the per-share price with no change in value. The only quant work here is correctness: your price history must be split- and bonus-adjusted, or a backtest will read a 1-for-2 split as a 50% crash. This corporate-action adjustment is a core data-hygiene job revisited in Chapter 68 on backtest bias.
- Dividends drop the price by roughly the dividend on the ex-date. For a derivatives quant this matters directly: expected dividends sit inside the cash-futures basis (Chapter 50), so a future looks "cheap" by exactly the dividend it will not pay you. Model the dividend and the apparent mispricing vanishes.
- Buybacks - especially tender-offer buybacks at a fixed price above market - are a genuine event play. If the buyback price is meaningfully above the traded price, the acceptance ratio (what fraction of your tendered shares the company actually buys back) drives the return, and small shareholders often enjoy a reserved, higher acceptance ratio. The edge is real arithmetic, but the acceptance ratio is uncertain and the residual unbought shares carry market risk until you sell them.
Build an event study as a small, reusable function: take a list of event dates and a price series, align each event at day zero, and return the average and dispersion of forward returns over the next N days. Once you have it, every event in this chapter - reconstitution, earnings, ex-dates, buyback announcements - becomes the same three lines of code with a different date list. Reuse beats re-deriving.
Designing event trades and controlling risk
Event strategies have a distinct character that shapes how you build and size them. The recipe is consistent: define the event precisely (its trigger and its date), run an event study on history to measure the typical reaction and drift, trade only the predictable part, and - most importantly - respect the discrete risk.
Unlike a smooth signal that nudges your position a little each day, an event is often binary: the company either beats or misses, the stock is either added or not. That lumpiness means one bad event can erase many good ones, so position sizing (Chapter 72) and hard per-event limits matter more than usual. Two further disciplines: never let a single name or date dominate the book, and be ruthless about point-in-time data - using an announcement, an estimate, or a final index list before it was actually public is the most common way an event backtest lies to you.
The danger in event trading is the fat tail you did not study. An earnings event is exactly when a stock can gap 15% against you, when single-stock liquidity thins, and when a crowded name can land on the F&O ban list and become hard to hedge. Size every event trade for the move it can make against you, not the average move it usually makes, and assume your stop may fill far through its level on the gap.
Event-driven edges come from forced or predictable behaviour, not clever prediction - an index fund that must buy, a price that must adjust for a split, news the market is slow to digest. They are some of the most robust edges in India precisely because the other side is not trying to win; it is trying to comply. Find who is forced to act, measure the reaction with an honest event study, and position ahead of them while sizing for the binary risk.
Try it yourself
- Run a mini event study: for the last several Nifty reconstitutions, did added stocks outperform in the weeks around the effective date, net of costs?
- Take a basket of recent large result-day gaps (detect them from history) and average the next-ten-day path, a rough proxy for post-earnings drift.
- Build a calendar overlay: only take long trades on the historically strong weekdays. Does avoiding the weak days improve a simple strategy's net return?
Recap
- Event-driven strategies trade scheduled dates and forced flows, not chart patterns - structural edges from participants who must act.
- Calendar effects are real: Monday was Nifty's weakest and most volatile day (weekend news repricing), Tuesday the strongest.
- Post-event drift, including post-earnings-announcement drift, is the classic event edge - the market underreacts then drifts, and an event study is how you find and size it.
- Index reconstitution forces index funds to buy added stocks; corporate actions (splits, bonuses, dividends, buybacks) are mechanical, modellable events with their own data-hygiene and arbitrage angles.
- Event trades carry discrete, binary risk, so precise definition, point-in-time data, event studies and disciplined sizing are essential.
We have traded the calendar - the dates on which participants are forced to act. The next chapter reads the flows those participants leave behind: open-interest build-up, FII and DII footprints, the F&O ban list and expiry-day effects - positioning signals you measure rather than predict.