
Plotting
The six calls that put a study's numbers on the chart, plot, plotCandles, level, fill, background and barColor, with every argument, style and rule the compiler enforces.
On this page
This page is the reference for the six calls that draw what a study computes:
plot()draws a line, a histogram or another style of one value per bar.plotCandles()draws candles built from four values of your own.level()draws a horizontal reference line.fill()shades the band between two plotted lines.background()shades the whole height of a bar, behind everything else.barColor()recolours the instrument's own candles.
Almost every study in OpenScript (also called OpenAlgo Script) uses some of them. The compiler enforces a few of their rules, such as which calls must sit at the top level of the file, so read the first sections before you write your first study.
A Supertrend study on a BHEL 15 minute chart is built from two of them. plot() draws the line twice, green while the trend is up and red while it is down, and fill() shades between the line and the middle of each candle's body. The BUY and SELL labels on each flip come from signal():
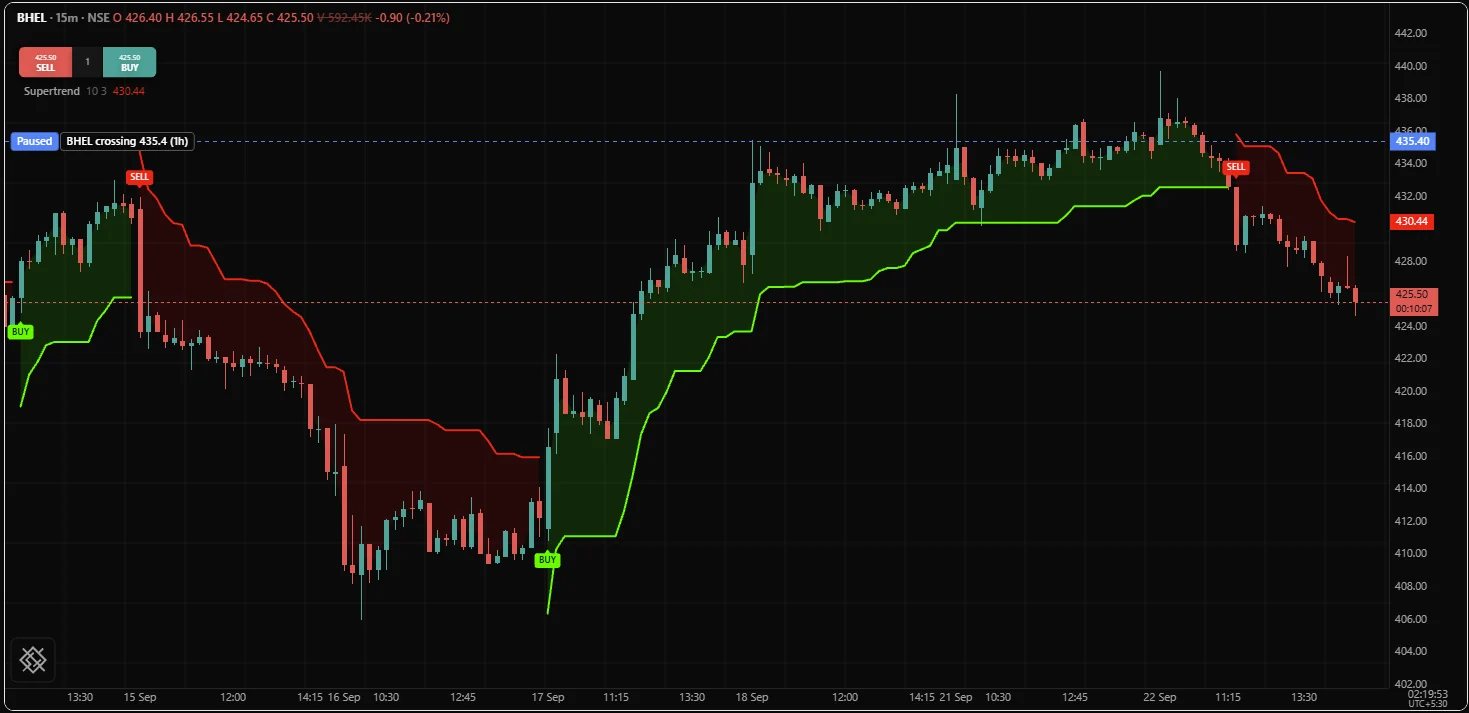
Here is one study that uses five of the six:
version 1
study("Band regime", overlay = true, precision = 2)

len  = input(20,  "Length", min = 2, max = 500)
mult = input(2.0, "Deviations", min = 0.1, max = 5)

// bollinger returns three values: b[0] is the basis, b[1] the upper band, b[2] the lower.
b = bollinger(close, len, mult)

// Two named plots, so the fill below can shade between them.
upper = plot(b[1], "Upper", fade(aqua, 40))
lower = plot(b[2], "Lower", fade(aqua, 40))
plot(b[0], "Basis", orange, width = 2)
fill(upper, lower, color = aqua, opacity = 0.08)

// Yesterday's high, read from the daily bars that have closed.
level(req.timeframe("1D", high), "Previous day high", fade(silver, 30))

// Per-bar paint: a colour of none leaves that bar alone.
barColor(close > b[1] ? lime : close < b[2] ? red : none)
background(session.isIn("0915-0930") ? fade(yellow, 92) : none)
Where each call may appear
The top level of a file is everything written directly in it, outside any if, loop or function body. Four of these calls declare part of the study's fixed shape: the columns in its legend, the rows of its settings dialog, its bands and its levels. That shape has to exist before the first bar runs, so those four calls are top level only. The two paint calls are per-bar output and may appear anywhere.
| Call | Returns | Where it may appear | Read on every bar |
|---|---|---|---|
plot() | a plot handle | Top level only | The value and the colour |
plotCandles() | a plot handle | Top level only | The four prices and the colours |
level() | a level handle | Top level only | The price |
fill() | a fill handle | Top level only | The colours |
background() | nothing | Anywhere | The colour |
barColor() | nothing | Anywhere | The colour |
A top-level-only call inside an if, a loop or a function body is error OS3006. You never need one there: to hide a plot, a level or a band on some bars, give it none on those bars.
ema20 = ema(close, 20)
trending = adx(14, 14)[0] > 25
if trending
    plot(ema20, "EMA 20", aqua)
// Compute the average on every bar, then choose per bar what to draw.
ema20 = ema(close, 20)
trending = adx(14, 14)[0] > 25
plot(trending ? ema20 : none, "EMA 20", aqua)Compute an indicator at the top level and choose what to draw afterwards. An indicator called inside an if or inside one arm of ? : only advances on the bars where that branch runs, and the compiler warns with OS8001.
Handles
plot(), plotCandles(), level() and fill() each return a declaration handle: a name for the column, line or band they declared. A handle exists only while the script is compiled and has no value on any bar. You may name it at the top level, directly from the call, and pass it to fill(), which is the only call that takes one. Everything else is refused:
| Doing this with a handle | Error |
|---|---|
Arithmetic, such as p + 1 | OS2003 |
Keeping it in a var | OS2003 |
| Passing it to a function of your own | OS2003 |
| Putting it in an array | OS2019 |
Reading a past value with [] | OS2004 |
p = plot(close, "Close")
q = p + 1
Drawing objects are the opposite kind of thing: draw.line() and its siblings return ordinary values you keep and change as bars arrive. See Drawing objects.
Absence draws a gap
A value that is none never draws as zero. A plot breaks its line, a candle is not drawn, a level disappears, a band stops, and a bar given no colour keeps its own. That is why warmup needs no special code: an indicator is none until it has enough bars, so its line simply starts later. See Absent values.
Arguments fixed before the first bar
The parameter tables below mark every argument that is fixed before the first bar. The chart builds the legend, the axes and the settings dialog from these arguments before any bar runs, so each one must be written at the call as one of:
| Accepted | Example |
|---|---|
| A literal | width = 2, style = "step" |
| Arithmetic over literals | offset = -2 * 3 |
| A colour built from literals | fade(gray, 55) |
An input(), at the call or held in a name of its own | width = input(2, "Width") |
Anything that depends on bar data is error OS3003. So is a name that holds a plain value: w = 2 followed by width = w is refused, so write the 2 at the call or make it an input. Arithmetic on an input, such as offset = -rightBars, is refused too; declare the input with the value you want instead.
The fixed arguments are a plot's title, width, style, offset, overlay, precision, format and scale; a level's title, colour, style and width; and a band's opacity and overlay. The value you draw is read on every bar, and so is the colour of plot(), plotCandles() and fill().
Plotted columns
plot()
Draws one number per bar as a column: a line, a histogram, an area or one of the other styles below. The number comes from whatever you computed; plot computes nothing itself. The title is required and names the column in the legend and in the settings dialog, where a user can restyle it.
plot(
    value: series number,
    title: string,
    color?: color = none,
    width?: number = 1.5,
    style?: string = "line",
    offset?: number = 0,
    overlay?: bool = none,
    precision?: number = none,
    format?: string = none,
    scale?: string = "right"
) -> plot| Parameter | Type | Default | Description |
|---|---|---|---|
value | series number | required | The number to draw on this bar, read on every bar. A none value leaves a gap in the column, so warmup needs no special code. |
title | string | required | The column's name in the legend and in the settings dialog, where a user can restyle it. It is required, so plot(x) alone is error OS3012. Fixed before the first bar |
color | color | none | The colour of the column: one fixed colour such as aqua, or an expression that picks a colour per bar, such as hist > 0 ? lime : red. Left out, the host picks the next colour from its palette. |
width | number | 1.5 | The line thickness. Keep one line heavier than the rest so a reader knows which one to follow. Fixed before the first bar |
style | string | "line" | How the column is drawn: "line" joins the values, "lineWithMarkers" adds a mark at each value, "step" holds each value flat until it changes, "area" fills to the axis, "histogram" draws a bar from zero and "column" a bar from the axis. One of "line", "lineWithMarkers", "step", "area", "histogram", "column". Fixed before the first bar |
offset | number | 0 | Moves where the column is drawn by this many bars, never what it holds: a positive offset draws to the right, a negative one back over history, which is how a pivot is drawn on the bar it formed on. A whole number. Fixed before the first bar |
overlay | bool | none | true draws this one column on the price pane. Left out, the column lands in the pane the study's declaration chose. Fixed before the first bar |
precision | number | none | The number of decimals on the axis the plot maps to. It formats that shared axis, not this one line, and rounds no value; use round() to change a value. A whole number. Fixed before the first bar |
format | string | none | How the axis the plot maps to shows its numbers: "price", "percent" or "volume". It is display only, so "percent" divides nothing by a hundred. One of "price", "percent", "volume". Fixed before the first bar |
scale | string | "right" | The axis the column maps to within its pane: "right" is the right-hand price axis, "left" a second axis for a series in other units, and "none" no axis, for a column whose size would flatten everything else. One of "right", "left", "none". Fixed before the first bar |
- Returns
plot- First value
- bar 0
version 1
study("MACD", precision = 2)

m = macd(close, 12, 26, 9)

level(0, "Zero", fade(gray, 55), style = "solid")

// Declared first, so it sits under the two lines.
plot(m[2], "Histogram", color = m[2] > 0 ? fade(lime, 30) : fade(red, 30), style = "histogram")
plot(m[0], "MACD", aqua, width = 2)
plot(m[1], "Signal", orange)
The six styles:
style | Draws | Use it for |
|---|---|---|
"line" | A line joining consecutive values. The default | A value that changes every bar |
"lineWithMarkers" | The same line with a mark at every value | Sparse values, such as pivots, that are absent on most bars |
"step" | A flat segment per bar, jumping where the value changes | A value that changes only now and then: a daily read, an opening range, a stop |
"area" | A line with the region to the axis filled | One quantity whose level is the story |
"histogram" | A bar from zero to the value | A signed quantity, read above and below zero |
"column" | A bar from the axis to the value | A quantity that is never negative, such as volume |
A value read once a day and drawn as a line slopes from one reading to the next, and every point on the slope is a number the script never had. Draw it as a step:
version 1
study("Previous day high", overlay = true, precision = 2)
plot(req.timeframe("1D", high), "Previous day high", aqua, width = 2, style = "step")
Colour. One argument takes both a fixed colour and a colour that changes per bar. Pass aqua and the plot is always aqua; pass an expression such as hist > 0 ? lime : red and each bar gets its own. Leave it out and the host, the application drawing the chart such as the /trading page, picks the next colour from its palette. See Colors.
Offset. offset moves where the column is drawn, never what it holds. A positive offset draws values to the right, into the space past the newest bar; a negative one draws them back over history, which is how a pivot, known only some bars later, is drawn on the bar it formed on:
version 1
study("Pivot highs", overlay = true, precision = 2)

// A pivot is reported 5 bars after it forms, so draw it 5 bars back.
ph = pivotHigh(high, 5, 5)
plot(ph, "Pivot high", orange, style = "lineWithMarkers", offset = -5)
The offset is a whole number fixed before the first bar, so offset = -rightBars on an input is refused. When the pivot's right side is an input, declare a second input with the negative default, or write the literal as above.
Pane and axis. A plot lands in the pane the declaration chose. overlay = true on one plot moves just that column onto the price pane. scale picks the axis within the pane:
scale | Means |
|---|---|
"right" | The right-hand price axis. The default |
"left" | A second axis on the left, for a series in different units on the same pane |
"none" | No axis, for a column whose size would flatten everything else |
precision (decimals, a whole number) and format ("price", "percent" or "volume") on a plot format the axis the plot maps to, not that one line, because an axis is shared. On a plot drawn over the price pane that reformats the instrument's own axis; in a study declared with overlay = true, the compiler warns about it with OS8007. Set them on the declaration of a study with its own pane instead. Formatting is display only: format = "percent" divides nothing by a hundred and precision = 2 rounds nothing; use round() to change a value.
Remarks. A plot has a value from bar 0, and its line starts wherever its value first exists. The title has no default, so plot(x) is error OS3012. Plots are drawn in the order they are declared, so declare a histogram before the lines that should sit on top of it. A stop that changes sides is best drawn as two plots, each none while the other is in use, so the line never cuts vertically through the candles on the flip bar.
See also. plotCandles(), fill(), level(), Plots, Colors
plotCandles()
Draws bar-shaped output from four series of your own: a candle per bar with a body from open to close and wicks to the high and low. The candle takes colorUp where its close is at or above its open and colorDown where it is below. Use it for smoothed candles, or for a coarser timeframe's candle drawn over a finer chart.
plotCandles(
    open: series number,
    high: series number,
    low: series number,
    close: series number,
    title: string,
    colorUp?: color = #00ff00ff,
    colorDown?: color = #ff0000ff,
    wickColor?: color = none,
    borderColor?: color = none
) -> plot| Parameter | Type | Default | Description |
|---|---|---|---|
open | series number | required | The price each candle's body starts from, read on every bar. On a bar where the sources are none, as during warmup, no candle is drawn. |
high | series number | required | The top of each candle's upper wick, read on every bar. |
low | series number | required | The bottom of each candle's lower wick, read on every bar. |
close | series number | required | The price each candle's body ends at. A candle whose close is at or above its open takes colorUp, and one below it takes colorDown. |
title | string | required | The name of the candles in the legend and in the settings dialog. It is required. Fixed before the first bar |
colorUp | color | #00ff00ff | The body colour of a candle whose close is at or above its open. It may change from bar to bar. |
colorDown | color | #ff0000ff | The body colour of a candle whose close is below its open. It may change from bar to bar. |
wickColor | color | none | The colour of the wicks. Left as none, each wick is drawn in its body's colour on that bar. |
borderColor | color | none | The colour of the body's outline. Left as none, each border is drawn in its body's colour on that bar. |
- Returns
plot- First value
- bar 0
version 1
study("Averaged candles", precision = 2)

// Each candle opens halfway through the previous one and closes at the
// average of its own four prices, which smooths out the noise.
var avgOpen = none
avgClose = ohlc4
avgOpen = isNone(avgOpen) ? (open + close) / 2 : (avgOpen + avgClose[1]) / 2
avgHigh = max(high, max(avgOpen, avgClose))
avgLow  = min(low, min(avgOpen, avgClose))

plotCandles(avgOpen, avgHigh, avgLow, avgClose, "Averaged", colorUp = teal, colorDown = maroon)
Remarks. Where the sources are none, as during warmup, no candle is drawn. The handle is a plot, so fill() can name it; a band drawn to it follows its close. wickColor and borderColor default to none, which draws the wick and the border in the body's own colour for that bar; set them only to override that. Drawn over the price pane, faded colours keep the instrument's own candles readable underneath. plotCandles draws its own candles; to recolour the instrument's candles, use barColor().
See also. plot(), req.timeframe(), barColor(), Plots
Reference lines
level()
Draws one horizontal line straight across the study's pane at one price: 70 and 30 on an oscillator, zero under a histogram, yesterday's high on a price chart. A level takes no column, has no history and shows no value in the legend, which is what makes it the right tool for a threshold and the wrong one for a measurement.
level(
    price: series number,
    title?: string = "",
    color?: color = #808080ff,
    style?: string = "dashed",
    width?: number = 1
) -> level| Parameter | Type | Default | Description |
|---|---|---|---|
price | series number | required | The price the horizontal line is drawn at. It is read on every bar and the line drawn is the one from the last bar executed, so an absent price on the newest bar draws no line. |
title | string | "" | The line's name. Give every level one, since it is the line's only label: a level shows no value in the legend. Fixed before the first bar |
color | color | #808080ff | The line's colour, one colour fixed for the whole chart. Fixed before the first bar |
style | string | "dashed" | The line pattern: "solid", "dashed" or "dotted". One of "solid", "dashed", "dotted". Fixed before the first bar |
width | number | 1 | The line thickness. Fixed before the first bar |
- Returns
level- First value
- bar 0
version 1
study("RSI with zones", precision = 2, range = [0, 100])

len = input(14, "Length", min = 2, max = 200)

level(70, "Overbought", fade(red, 40))
level(50, "Middle", fade(gray, 70), style = "dotted")
level(30, "Oversold", fade(lime, 40))

plot(rsi(close, len), "RSI", purple, width = 2)
The price may be computed from the data. It is read on every bar, and the line drawn is the one from the last bar executed. So a price that exists on only one bar usually draws nothing: hold it in a var instead.
version 1
study("Session open", overlay = true, precision = 2)

// The session's first bar, or the first bar of the IST day where the host
// states no session hours.
newSession = orElse(session.isFirstBar, isNone(time[1]) or not date.isSameDay(time, time[1], "Asia/Kolkata"))

var sessionOpen = none
if newSession
    sessionOpen = open

// Held, so the newest bar has a price to draw.
level(sessionOpen, "Session open", fade(aqua, 25), style = "solid", width = 2)
Remarks. An absent price on the last bar draws no line, which is the way to switch a level off, for example pos.isFlat ? none : pos.avgPrice in a strategy. A level cannot be one end of a fill() (error OS3020); plot the value instead, fully transparent if the line itself should not show. When you want to see where a value used to be, it is not a level: draw it with plot(x, "Title", style = "step"). Give every level a title, since it is the line's only label.
See also. plot(), fill(), Levels, Declarations
Bands
fill()
Shades the region between two plots. A band turns "which line is higher, and by how much" into a colour a reader takes in at a glance, which is why it suits a volatility band, a moving average cross, or an oscillator shaded to its midline. Its first two arguments are the handles that plot() or plotCandles() returned, not values.
fill(
    plotA: plot,
    plotB: plot,
    color?: color = none,
    colorUp?: color = none,
    colorDown?: color = none,
    opacity?: number = 1,
    overlay?: bool = none
) -> fill| Parameter | Type | Default | Description |
|---|---|---|---|
plotA | plot | required | The first plot of the band: the handle a plot() or plotCandles() call returned, not a value. colorUp paints where this plot is above plotB. |
plotB | plot | required | The second plot of the band, also a handle returned by plot() or plotCandles(). A value in its place is error OS3020. |
color | color | none | One colour for the whole band. It cannot be given together with colorUp or colorDown (OS3010). With no colour given at all, the band takes plotA's colour faded to twelve percent. |
colorUp | color | none | The band's colour where plotA is above plotB. |
colorDown | color | none | The band's colour where plotA is below plotB. |
opacity | number | 1 | A dimmer from 0 to 1 that multiplies whatever transparency the colours already have. Dimming with both opacity and fade() compounds, so pick one. Fixed before the first bar |
overlay | bool | none | true draws the band on the price pane. The band and the two plots it names must end up in the same pane, which the compiler does not check. Fixed before the first bar |
- Returns
fill- First value
- bar 0
version 1
study("EMA cross, shaded", overlay = true, precision = 2)

fast = ema(close, 9)
slow = ema(close, 21)

pFast = plot(fast, "Fast", aqua, width = 2)
pSlow = plot(slow, "Slow", orange, width = 2)

// pFast comes first, so colorUp paints where the FAST average is higher.
fill(pFast, pSlow, colorUp = fade(lime, 85), colorDown = fade(red, 85))| Colour arguments | The band is |
|---|---|
| None of the three | plotA's colour, faded to twelve percent |
color | That colour on both sides |
colorUp and colorDown | colorUp where plotA is above plotB, colorDown where it is below |
Giving color together with colorUp or colorDown is error OS3010. Passing a value where a handle belongs is error OS3020:
pClose = plot(close, "Close")
fill(pClose, open)
To shade to a fixed value, which a level() cannot do, plot the value as a column and make it invisible. fade() takes a transparency in percent, so fade(c, 100) is fully transparent.
version 1
study("RSI shaded to 50", precision = 2, range = [0, 100])

pRsi = plot(rsi(close, 14), "RSI", purple, width = 2)
pMid = plot(50, "Midline", fade(gray, 100))
fill(pRsi, pMid, colorUp = fade(lime, 86), colorDown = fade(red, 86))
Remarks. A band stops wherever either of its plots is none and resumes where both return, so it inherits their warmup with no code from you. opacity is a dimmer from 0 to 1 that multiplies whatever transparency the colours already have. It defaults to 1 and is fixed before the first bar; dimming with both opacity and fade() compounds, so pick one. A band and the two plots it names must end up in the same pane, and the compiler does not check it: give both plots the same overlay and offset, and the band the same overlay. On the /trading chart in this release a band takes one colour: a colour computed per bar, such as color = squeezed ? orange : none, is not applied bar by bar, and the band is drawn in plotA's colour faded instead. To switch a band off on some bars there, make one of its plots none on those bars.
Paint
background()
Shades the full height of this bar's column, behind the candles, plots and everything else in the pane the study draws in. It is the surface for a fact about a bar that has no price: the first fifteen minutes of the session, an expanded volatility regime, a study that is still warming up.
background(color: color) -> nothing| Parameter | Type | Default | Description |
|---|---|---|---|
color | color | required | The shade for the full height of this bar, behind everything else in the pane. none leaves the bar unshaded, and when the script calls it more than once on a bar the last call wins. |
- Returns
nothing- First value
- bar 0
version 1
study("Opening window", overlay = true)

window = input("0915-0930", "Shade this window")

background(session.isIn(window) ? fade(silver, 90) : none)
Remarks. background(none) leaves the bar unshaded, which is how a conditional wash switches itself off, so the call rarely needs an if around it. If a script calls it more than once on a bar, the last call wins, and a last call with none clears the shade. It covers the whole bar, so keep colours faint: fade(c, 90), which is 90 percent transparent, is a good place to start. Paint is recomputed on every update of the newest bar and is never deferred the way signal() and alert() are; guard it with bar.isConfirmed if only settled bars should be shaded. A zone with a top and a bottom is not a background; draw it with draw.box().
See also. barColor(), fade(), session.isIn(), Bar colouring and backgrounds
barColor()
Recolours the instrument's own candles on this bar. A candle's colour already tells the reader whether it closed up or down, so repaint it only to show something they cannot read off the candle, such as the trend or which side of a stop price is on, and pass none on the bars that do not matter.
barColor(color: color) -> nothing| Parameter | Type | Default | Description |
|---|---|---|---|
color | color | required | The colour for the instrument's own candle on this bar. none leaves the candle its own colour, and when the script calls it more than once on a bar the last call wins. |
- Returns
nothing- First value
- bar 0
version 1
study("Trend regime", overlay = true, precision = 2)

paint = input(true, "Recolour the candles")

fast = ema(close, 20)
slow = ema(close, 50)
up = fast > slow

// Three states: during warmup up is none, and the bar keeps its colour.
tint = isNone(up) ? none : (up ? lime : red)
barColor(paint ? tint : none)

plot(fast, "Fast", aqua)
plot(slow, "Slow", orange)
Remarks. up ? lime : red alone would paint every warmup bar red, because an absent condition takes the false branch; test isNone() first, as above. Within one script the last call on a bar wins, including a last call with none. The candles belong to the chart, not to your study: when several studies on one chart call barColor, only one study's colours are drawn and the others' are not, so give users an input to switch your colouring off, as the example does. Like background(), it is recomputed on every update of the newest bar.
See also. background(), plotCandles(), Bar colouring and backgrounds
Related
Visuals overview, Plots, Levels, Fills, Colors reference, Drawing objects, Tables, Declarations.