
Drawing objects
The draw namespace, lines, labels, boxes and polylines a script creates, moves, restyles and deletes as bars arrive, with every setter and the lifecycle rules that keep a long chart fast.
On this page
A plot is one value per bar. A drawing object is a shape with anchors of its own: a trendline between two swing lows, a box over the 09:15 opening range, a label beside the newest bar, a path through the last dozen swings. The draw namespace creates these objects, changes them as bars arrive and deletes them when they are no longer wanted. This page is the reference for all twenty draw functions in OpenScript (also called OpenAlgo Script), and for the handful of rules that decide whether a drawing study stays fast on a chart of fifty thousand bars.
Here is the pattern most drawing studies follow: create an object once, move it on later bars, and keep a capped list of old ones.
version 1
study("Opening range boxes", overlay = true, precision = 2)

rangeMinutes = input(15, "Opening range, in minutes", min = 1, max = 240)
keepSessions = input(5,  "Sessions to keep", min = 1, max = 60)

// The session's first bar, or the first bar of each IST day where the host
// states no session hours.
newSession = orElse(session.isFirstBar, isNone(time[1]) or not date.isSameDay(time, time[1], "Asia/Kolkata"))

var openTime  = none
var rangeHigh = none
var rangeLow  = none
var zone      = none
var zones     = []

if newSession
    openTime  = time
    rangeHigh = high
    rangeLow  = low
    zone      = none

elapsed = isNone(openTime) ? none : time - openTime
forming = not isNone(elapsed) and elapsed < rangeMinutes * 60000

if forming
    rangeHigh = max(rangeHigh, high)
    rangeLow  = min(rangeLow, low)
    if isNone(zone)
        // Created once per session...
        zone = draw.box(openTime, rangeHigh, time, rangeLow, color = aqua, fillColor = aqua, opacity = 0.08)
        push(zones, zone)
        // ...and the oldest deleted once there are more than you keep.
        if size(zones) > keepSessions
            draw.delete(shift(zones))
    else
        draw.setBounds(zone, openTime, rangeHigh, time, rangeLow)
else if not isNone(zone)
    // The range is final: only the right edge follows the session.
    draw.setTo(zone, time, rangeLow)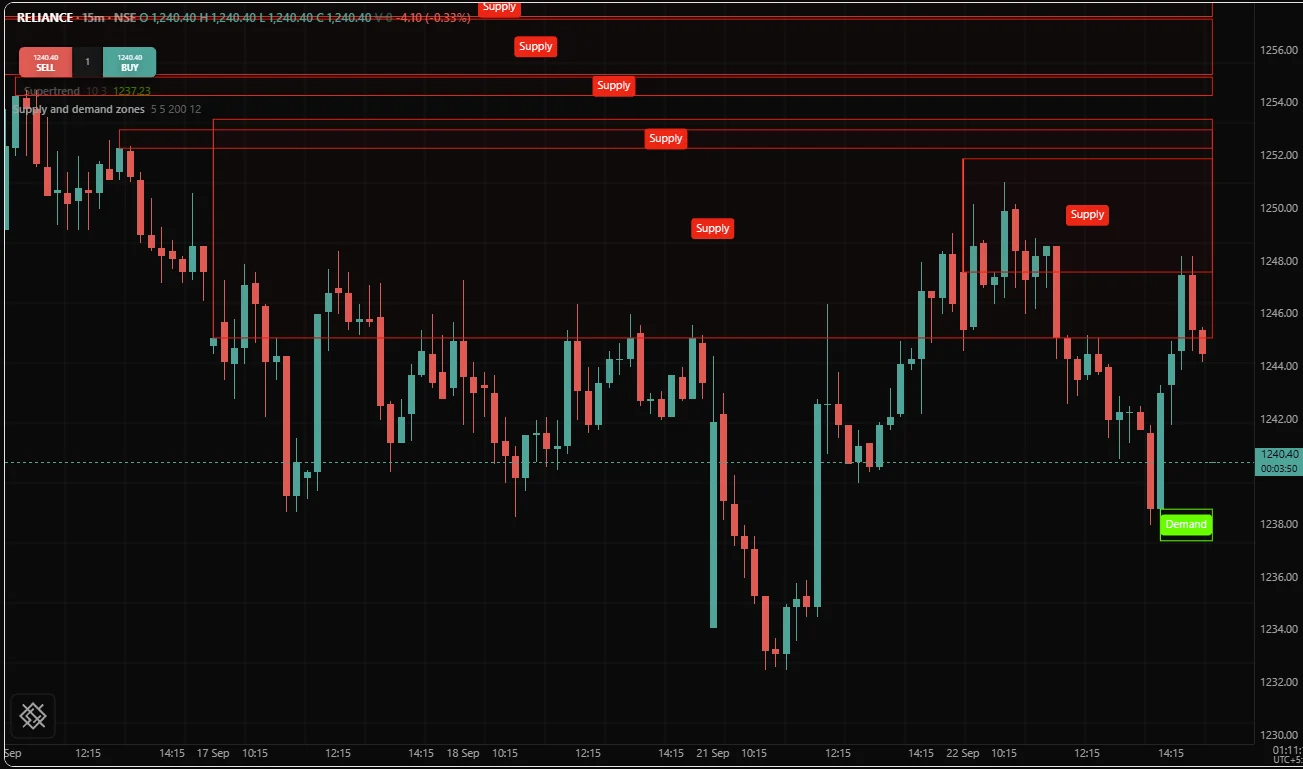
The examples on this page that reset once per session find the session's first bar with the newSession line above. session.isFirstBar needs the instrument's session hours, which the /trading chart states from the platform's market calendar; where a host states none, a new IST date marks the same bar for an NSE, BSE or MCX session.
How drawing objects work
Anchors are a time and a price. Every point is a timestamp in UTC milliseconds, usually time or time[n], and a price on the scale of the pane the study draws in. An object is never anchored to a bar index, so it stays where you put it when the chart loads more history and every index shifts. In a study with its own pane, the "price" is a reading on that pane's scale, such as an RSI value.
They may be created anywhere. Unlike plot(), every draw call may appear inside an if, a loop or a function.
They are ordinary values. draw.line(), draw.label(), draw.box() and draw.polyline() return a line, label, box or polyline. You can keep one in a var, hold many in an array, pass one to a function and compare one with none. Two names for the same object are one object, and == tests identity.
They live until you delete them. Dropping the last name that refers to an object does not remove it: the chart keeps drawing it until draw.delete() or draw.deleteAll() does. Each host, the application running the script such as the /trading page, sets a ceiling on how many objects one script may hold; the engine's default, which the /trading chart uses, is 10,000. Creating one more stops the script on that bar with OS5010, rather than quietly dropping the oldest. So decide how each object ends before you write the line that creates it:
| Lifecycle | How it is written | Objects on the chart | Use it for |
|---|---|---|---|
| One object, moved | Create while the var is none, then call setters | One per thing drawn | Something that always exists: a level, a range, a tag |
| A capped list | push() on create, draw.delete(shift(list)) over the cap | At most the cap | One object per event: zones, pivots, breakouts |
| Create and forget | A bare draw.line(...) on an event | One per event, for ever | Only when the event count is small and known |
The newest bar is rolled back. On a moving chart the newest bar runs again on every update, and before each run the set of objects is restored to what it was at the end of the previous bar, exactly as var values are. A script that creates a label on the newest bar gets one label, not one per update. Keep handles in var, never in live var: a live var survives the rollback, so after the next update it holds a handle to an object the rollback removed, and changes made through it draw nothing.
A deleted object stays deleted. A setter called on an object that has been deleted is error OS4005, which stops the script on that bar. A setter given none does nothing, and so does draw.delete() given none or an object already deleted. So assign none to the name on the same lines that delete the object, test isNone() before changing it, and when objects live in an array, remove the element as well: deleting the object does not.
Absent values draw nothing. An object whose anchor has no time or no price is not drawn, and a colour of none is fully transparent rather than a default colour.
Objects are written, not read. There is no call that asks an object where it is. When a script needs the numbers later, to see whether price has closed through a zone, it keeps them itself in its own vars or arrays beside the handles.
Which setter takes which object
Each setter takes only the kinds of object that have the property it writes. Passing another kind is error OS3011 when the script is compiled.
| Call | line | label | box | polyline |
|---|---|---|---|---|
draw.setFrom(), draw.setTo(), draw.setBounds() | yes | yes | ||
draw.setAt() | yes | |||
draw.setPoints() | yes | |||
draw.setExtend(), draw.setStyle() | yes | |||
draw.setText(), draw.setTextColor(), draw.setTooltip() | yes | yes | ||
draw.setFillColor() | yes | yes | ||
draw.setWidth() | yes | yes | yes | |
draw.setColor(), draw.delete() | yes | yes | yes | yes |
tag = draw.label(time, high, "high")
draw.setFrom(tag, time, low)
Creating objects
draw.line()
Creates a straight line between two anchors, (t1, p1) and (t2, p2), and returns it. Use it for trendlines, a line joining two pivots, or a horizontal line that starts and stops rather than crossing the whole pane. extendLeft and extendRight continue it past its anchors to the edge of the pane.
draw.line(
    t1: number,
    p1: number,
    t2: number,
    p2: number,
    color?: color = gray,
    width?: number = 1,
    style?: string = "solid",
    extendLeft?: bool = false,
    extendRight?: bool = false
) -> line| Parameter | Type | Default | Description |
|---|---|---|---|
t1 | number | required | The time of the first anchor, a timestamp in UTC milliseconds such as time or time[n]. |
p1 | number | required | The price of the first anchor, on the scale of the pane the study draws in. |
t2 | number | required | The time of the second anchor, a timestamp like t1. |
p2 | number | required | The price of the second anchor. |
color | color | gray | The line colour. |
width | number | 1 | The line thickness. |
style | string | "solid" | The line pattern: "solid", "dashed" or "dotted". One of "solid", "dashed", "dotted" |
extendLeft | bool | false | true continues the line past its first anchor to the left edge of the pane. |
extendRight | bool | false | true continues the line past its second anchor to the right edge of the pane, which is how a line reaches into the space past the newest bar. |
- Returns
line- First value
- bar 0
version 1
study("Pivot low trendline", overlay = true, precision = 2)

rightBars = input(5, "Pivot right bars", min = 1, max = 50)

pl = pivotLow(low, 5, rightBars)

var prevTime  = none
var prevPrice = none
var trend     = none

if not isNone(pl)
    // A pivot is reported rightBars bars late, so anchor it where it formed.
    pivotTime = time[rightBars]
    if not isNone(prevTime)
        if isNone(trend)
            trend = draw.line(prevTime, prevPrice, pivotTime, pl, color = lime, width = 2, extendRight = true)
        else
            draw.setBounds(trend, prevTime, prevPrice, pivotTime, pl)
    prevTime  = pivotTime
    prevPrice = pl
Remarks. Anchor a pivot at time[rightBars], the bar it formed on, not at time, the bar it was reported on. An extended line needs no upkeep: its anchors fix the slope and the chart draws the rest. To reach into the empty space past the newest bar, extend the line rather than computing a future timestamp: time - time[1] is the bar length inside a session but the whole overnight gap on a session's first bar.
See also. draw.setBounds(), draw.setExtend(), draw.setStyle(), Lines and boxes
draw.label()
Creates a plate of text anchored at a time and a price, and returns it. A label is an object you own: use it for a caption that belongs at a point, such as a pivot's price or the current reading beside the newest bar. For a marker on the bar where an event happened, signal() is simpler, because a signal has no handle to manage.
draw.label(
    t: number,
    p: number,
    text: string,
    color?: color = none,
    textColor?: color = white,
    align?: string = "center",
    tooltip?: string = ""
) -> label| Parameter | Type | Default | Description |
|---|---|---|---|
t | number | required | The time the label is anchored at, a timestamp in UTC milliseconds such as time or time[n]. |
p | number | required | The price the label is placed at, on the scale of the pane the study draws in. There is no pixel offset, so pad the price with a multiple of atr() to clear the candle. |
text | string | required | The caption. Keep it short and put the detail in tooltip. |
color | color | none | The colour of the plate behind the text. Left as none, no plate is drawn and the text sits straight on the chart. |
textColor | color | white | The colour of the text. Pick one that reads on the plate, or on the chart when there is no plate. |
align | string | "center" | Which part of the plate sits on the anchor's time: "center" centres it, "left" puts its left edge there so it extends to the right, and "right" puts its right edge there so it extends to the left. |
tooltip | string | "" | Detail shown while the pointer rests on the label. |
- Returns
label- First value
- bar 0
version 1
study("Pivot labels", overlay = true, precision = 2)

rightBars = input(5,   "Pivot right bars", min = 1, max = 50)
padding   = input(0.5, "Padding, in ATR",  min = 0, max = 5)
keep      = input(30,  "Labels to keep",   min = 1, max = 500)

pivotUp   = pivotHigh(high, 5, rightBars)
pivotDown = pivotLow(low, 5, rightBars)

// Padding measured in the instrument's own volatility clears the bar on
// a stock at 250 and on an index future at 25,000 alike.
pad = atr(14) * padding

var tags = []

if not isNone(pivotUp)
    push(tags, draw.label(time[rightBars], pivotUp + pad, text(pivotUp, 2), color = red, textColor = white))

if not isNone(pivotDown)
    push(tags, draw.label(time[rightBars], pivotDown - pad, text(pivotDown, 2), color = lime, textColor = black))

// A pivot high and a pivot low can land on one bar, so trim until the list fits.
while size(tags) > keep
    draw.delete(shift(tags))
Remarks. A label is placed at the price you give it; there is no pixel offset anywhere in the language, so pad with a multiple of atr() to clear the candle. color is the plate and defaults to none, which draws no plate at all: the text then sits straight on the chart in textColor, white by default, so give a label a plate colour or a text colour that reads on your chart. align decides which part of the plate sits on the anchor's time: "center" (the default) centres it, "left" puts the plate's left edge there so it extends to the right, and "right" puts its right edge there so it extends to the left. Keep the caption short and put detail in tooltip, which shows while the pointer rests on the label. text() of an absent value is the string "none", so guard captions built from values that may still be warming up. A label per bar is the commonest way to make a chart slow: a value on every bar is a plot().
See also. draw.setAt(), draw.setText(), signal(), Labels and shapes
draw.box()
Creates a rectangle between two corners, (t1, p1) and (t2, p2), and returns it. A box is the shape for a price band over a stretch of time: a supply or demand zone, an opening range, the range of a mother bar. It can carry a caption inside it and a tooltip.
draw.box(
    t1: number,
    p1: number,
    t2: number,
    p2: number,
    color?: color = none,
    fillColor?: color = none,
    opacity?: number = 0.12,
    width?: number = 1,
    text?: string = "",
    textColor?: color = white,
    tooltip?: string = ""
) -> box| Parameter | Type | Default | Description |
|---|---|---|---|
t1 | number | required | The time of the first corner, a timestamp in UTC milliseconds such as time or time[n]. |
p1 | number | required | The price of the first corner, on the scale of the pane the study draws in. |
t2 | number | required | The time of the opposite corner, a timestamp like t1. |
p2 | number | required | The price of the opposite corner. |
color | color | none | The border colour. Left as none, no border is drawn, so give a box a border or a fill for it to be seen. |
fillColor | color | none | The colour inside the box. Left as none, the box has no fill. |
opacity | number | 0.12 | How strongly the fill is drawn: the fill shows at opacity times the colour's own strength, and the default is faint enough to leave the candles readable. |
width | number | 1 | The thickness of the border. |
text | string | "" | A caption drawn inside the box. |
textColor | color | white | The colour of the caption. |
tooltip | string | "" | Detail shown while the pointer rests on the box, so the caption can stay short. |
- Returns
box- First value
- bar 0
version 1
study("Inside bar zones", overlay = true, precision = 2)

keep = input(10, "Zones to keep", min = 1, max = 100)

var zones = []

// An inside bar trades within the previous bar's range.
insideBar = high < high[1] and low > low[1]

if insideBar
    zone = draw.box(time[1], high[1], time, low[1], color = orange, fillColor = orange, text = "inside", textColor = orange)
    push(zones, zone)
    if size(zones) > keep
        draw.delete(shift(zones))
Remarks. color is the border and fillColor the inside; both default to none, which draws nothing, so a box needs at least one of them to be seen. opacity dims the fill and defaults to 0.12, faint enough to leave the candles readable. The caption is drawn in textColor, white by default. A box has no extend argument, so a box that should reach the current bar has its right edge moved there with draw.setTo() on each bar, which is one cheap call against one object. A regime with no top or bottom, such as "the first fifteen minutes", belongs in background(), not in a box.
See also. draw.setBounds(), draw.setText(), draw.setFillColor(), Lines and boxes
draw.polyline()
Creates one path through many points and returns it. The points come as two arrays of the same length, one of times and one of prices, paired by index. With closed = true the path returns to its first point, and with a fillColor it becomes a filled shape: a wedge, a triangle, an outline around a range.
draw.polyline(
    times: array<number>,
    prices: array<number>,
    color?: color = gray,
    width?: number = 1,
    closed?: bool = false,
    fillColor?: color = none,
    opacity?: number = 0.12
) -> polyline| Parameter | Type | Default | Description |
|---|---|---|---|
times | array<number> | required | The times of the points, timestamps in UTC milliseconds, paired by index with prices. The path is copied when the call runs, so changing the array afterwards redraws nothing. |
prices | array<number> | required | The prices of the points, paired by index with times, so keep the two arrays the same length. A point whose time or price is none is a gap in the path. |
color | color | gray | The colour of the path's stroke. |
width | number | 1 | The thickness of the stroke. |
closed | bool | false | true joins the last point back to the first, making a closed shape. |
fillColor | color | none | The colour inside the shape. Left as none, the shape has no fill. |
opacity | number | 0.12 | How strongly the fill is drawn: the fill shows at opacity times the colour's own strength. |
- Returns
polyline- First value
- bar 0
version 1
study("Last ten bars outline", overlay = true, precision = 2)

var outline = none

if bar.isLast
    times  = []
    prices = []
    // Along the highs, oldest first, then back along the lows.
    for i = 9 to 0 step -1
        push(times, time[i])
        push(prices, high[i])
    for i = 0 to 9
        push(times, time[i])
        push(prices, low[i])
    // One outline for the life of the chart: created once, then reshaped
    // as each new bar arrives.
    if isNone(outline)
        outline = draw.polyline(times, prices, color = purple, closed = true, fillColor = purple, opacity = 0.1)
    else
        draw.setPoints(outline, times, prices)
Remarks. The path is copied when the call runs. Pushing to the arrays afterwards changes nothing on the chart; draw.setPoints() is how a path changes. Keep the two arrays the same length: trim both together. A point whose time or price is none is a gap: the path is drawn in separate pieces on either side of it, and on the /trading chart a path with a gap is drawn open and unfilled, whatever closed and fillColor say.
See also. draw.setPoints(), push(), Lines and boxes
Moving objects
draw.setFrom()
Moves the first anchor of a line or box to a new time and price. The second anchor stays where it is.
draw.setFrom(obj: line or box, t: number, p: number) -> nothing| Parameter | Type | Default | Description |
|---|---|---|---|
obj | line or box | required | The line or box whose first anchor moves. The second anchor stays where it is. |
t | number | required | The new time of the first anchor, a timestamp in UTC milliseconds. |
p | number | required | The new price of the first anchor. |
- Returns
nothing- First value
- bar 0
version 1
study("Session high line", overlay = true, precision = 2)

// The session's first bar, or of the IST day where no session hours are stated.
newSession = orElse(session.isFirstBar, isNone(time[1]) or not date.isSameDay(time, time[1], "Asia/Kolkata"))

var hiPrice = none
var hiTime  = none
var hiLine  = none

if newSession or isNone(hiPrice) or high > hiPrice
    hiPrice = high
    hiTime  = time

if isNone(hiLine)
    hiLine = draw.line(hiTime, hiPrice, time, hiPrice, color = orange, style = "dashed")
else
    // The start follows the bar that made the high; the end follows this bar.
    draw.setFrom(hiLine, hiTime, hiPrice)
    draw.setTo(hiLine, time, hiPrice)
See also. draw.setTo(), draw.setBounds()
draw.setTo()
Moves the second anchor of a line or box to a new time and price. It is the everyday call for a shape whose right edge follows the newest bar.
draw.setTo(obj: line or box, t: number, p: number) -> nothing| Parameter | Type | Default | Description |
|---|---|---|---|
obj | line or box | required | The line or box whose second anchor moves. The first anchor stays where it is. |
t | number | required | The new time of the second anchor, a timestamp in UTC milliseconds. |
p | number | required | The new price of the second anchor. |
- Returns
nothing- First value
- bar 0
version 1
study("Session open line", overlay = true, precision = 2)

// The session's first bar, or of the IST day where no session hours are stated.
newSession = orElse(session.isFirstBar, isNone(time[1]) or not date.isSameDay(time, time[1], "Asia/Kolkata"))

var sessionOpen = none
var openLine    = none

if newSession
    // One line at a time: the previous session's is removed.
    if not isNone(openLine)
        draw.delete(openLine)
    sessionOpen = open
    openLine    = draw.line(time, open, time, open, color = aqua, width = 2)
else if not isNone(openLine)
    // The start stays at the session's first bar; the end follows this bar.
    draw.setTo(openLine, time, sessionOpen)
See also. draw.setFrom(), draw.setBounds()
draw.setBounds()
Moves both anchors of a line or box in one call. Use it when both ends of a shape change on the same bar, such as a range whose top, bottom and extent all move.
draw.setBounds(
    obj: line or box,
    t1: number,
    p1: number,
    t2: number,
    p2: number
) -> nothing| Parameter | Type | Default | Description |
|---|---|---|---|
obj | line or box | required | The line or box to move. |
t1 | number | required | The new time of the first anchor, a timestamp in UTC milliseconds. |
p1 | number | required | The new price of the first anchor. |
t2 | number | required | The new time of the second anchor. |
p2 | number | required | The new price of the second anchor. |
- Returns
nothing- First value
- bar 0
version 1
study("Twenty bar range", overlay = true, precision = 2)

top    = highest(high, 20)
bottom = lowest(low, 20)

var rangeBox = none
if not isNone(top)
    if isNone(rangeBox)
        rangeBox = draw.box(time[19], top, time, bottom, color = silver, fillColor = silver, opacity = 0.06)
    else
        draw.setBounds(rangeBox, time[19], top, time, bottom)
See also. draw.setFrom(), draw.setTo(), highest()
draw.setAt()
Moves a label to a new time and price. Together with draw.setText(), it keeps one label beside the newest bar for the life of the chart instead of creating a new one on every bar.
draw.setAt(label: label, t: number, p: number) -> nothing| Parameter | Type | Default | Description |
|---|---|---|---|
label | label | required | The label to move. |
t | number | required | The new time of the label's anchor, a timestamp in UTC milliseconds. |
p | number | required | The new price of the label's anchor. |
- Returns
nothing- First value
- bar 0
version 1
study("VWAP tag", overlay = true, precision = 2)

// The day's VWAP, restarted on the first bar of each IST day. vwap() restarts
// on the session's first bar, which needs session hours from the host, so
// this anchors it by date and works wherever a timezone is known.
newDay = isNone(time[1]) or not date.isSameDay(time, time[1], "Asia/Kolkata")
v = vwapAnchor(hlc3, newDay)
plot(v, "VWAP", orange, width = 2)

var tag = none
if bar.isLast
    if isNone(tag)
        tag = draw.label(time, v, "VWAP " + text(v, 2), color = fade(orange, 25), textColor = black)
    else
        draw.setAt(tag, time, v)
        draw.setText(tag, "VWAP " + text(v, 2))
Remarks. Only a label has a single anchor; lines and boxes move with draw.setFrom(), draw.setTo() and draw.setBounds().
See also. draw.label(), draw.setText()
draw.setPoints()
Replaces the whole path of a polyline with new arrays of times and prices. A polyline keeps its own copy of the points it was given, so this call is the only way its shape changes.
draw.setPoints(
    polyline: polyline,
    times: array<number>,
    prices: array<number>
) -> nothing| Parameter | Type | Default | Description |
|---|---|---|---|
polyline | polyline | required | The polyline whose whole path is replaced. |
times | array<number> | required | The new times of the points, timestamps in UTC milliseconds, paired by index with prices. |
prices | array<number> | required | The new prices of the points, paired by index with times. |
- Returns
nothing- First value
- bar 0
version 1
study("Swing path", overlay = true, precision = 2)

rightBars = input(5,  "Pivot right bars", min = 1, max = 50)
points    = input(12, "Points in the path", min = 3, max = 100)

pivotUp   = pivotHigh(high, 5, rightBars)
pivotDown = pivotLow(low, 5, rightBars)

var pathTimes  = []
var pathPrices = []
var path       = none

swing = isNone(pivotUp) ? pivotDown : pivotUp

if not isNone(swing)
    push(pathTimes, time[rightBars])
    push(pathPrices, swing)
    // Trim both arrays together, so they stay the same length.
    if size(pathTimes) > points
        shift(pathTimes)
        shift(pathPrices)
    if isNone(path)
        path = draw.polyline(pathTimes, pathPrices, color = purple, width = 2)
    else
        draw.setPoints(path, pathTimes, pathPrices)
See also. draw.polyline(), shift()
draw.setExtend()
Sets whether a line continues past its first anchor to the left edge of the pane and past its second anchor to the right edge. It changes what extendLeft and extendRight said when the line was created.
draw.setExtend(line: line, left: bool, right: bool) -> nothing| Parameter | Type | Default | Description |
|---|---|---|---|
line | line | required | The line to change. |
left | bool | required | true continues the line past its first anchor to the left edge of the pane; false stops it at the anchor. |
right | bool | required | true continues the line past its second anchor to the right edge of the pane; false stops it at the anchor. |
- Returns
nothing- First value
- bar 0
version 1
study("Support until broken", overlay = true, precision = 2)

pl = pivotLow(low, 5, 5)

var support      = none
var supportPrice = none
var broken       = false

if not isNone(pl)
    if not isNone(support)
        draw.delete(support)
    supportPrice = pl
    broken       = false
    support      = draw.line(time[5], pl, time, pl, color = lime, extendRight = true)
else if not isNone(support) and not broken and close < supportPrice
    // Broken: stop the ray at the breaking bar and grey it out.
    broken = true
    draw.setExtend(support, false, false)
    draw.setTo(support, time, supportPrice)
    draw.setColor(support, gray)
See also. draw.line(), draw.setTo()
Styling and text
draw.setColor()
Changes the colour of a line, or the border of a box, the plate of a label or the stroke of a polyline. Any object kind is accepted.
draw.setColor(obj: line, label, box or polyline, color: color) -> nothing| Parameter | Type | Default | Description |
|---|---|---|---|
obj | line, label, box or polyline | required | The line, label, box or polyline to recolour. |
color | color | required | The new colour: a line's colour, a box's border, a label's plate or a polyline's stroke. |
- Returns
nothing- First value
- bar 0
version 1
study("Last price line", overlay = true, precision = 2)

var lastLine = none
if bar.isLast
    if isNone(lastLine)
        lastLine = draw.line(time[1], close, time, close, style = "dotted", extendLeft = true, extendRight = true)
    else
        draw.setBounds(lastLine, time[1], close, time, close)
    draw.setColor(lastLine, close >= open ? lime : red)
See also. draw.setFillColor(), draw.setTextColor(), Colors
draw.setFillColor()
Changes the colour inside a box or a polyline. Use it to let a zone say something about price, for example whether the close is above it, inside it or below it.
draw.setFillColor(obj: box or polyline, color: color) -> nothing| Parameter | Type | Default | Description |
|---|---|---|---|
obj | box or polyline | required | The box or polyline to change. |
color | color | required | The new colour inside the shape. A box's opacity, set when it was created, still dims it. |
- Returns
nothing- First value
- bar 0
version 1
study("First bar break", overlay = true, precision = 2)

// The session's first bar, or of the IST day where no session hours are stated.
newSession = orElse(session.isFirstBar, isNone(time[1]) or not date.isSameDay(time, time[1], "Asia/Kolkata"))

var zone   = none
var top    = none
var bottom = none

if newSession
    if not isNone(zone)
        draw.delete(zone)
    top    = high
    bottom = low
    zone   = draw.box(time, high, time, low, color = aqua, fillColor = aqua, opacity = 0.1)
else if not isNone(zone)
    draw.setTo(zone, time, bottom)
    // Green above the session's first bar, red below it, aqua inside.
    draw.setFillColor(zone, close > top ? lime : close < bottom ? red : aqua)
Remarks. The box's opacity, set when it was created, still dims the new colour.
See also. draw.box(), draw.setColor()
draw.setTextColor()
Changes the colour of the text in a label or a box. Pair it with draw.setColor() when a label's plate changes, so the text stays readable on it.
draw.setTextColor(obj: label or box, color: color) -> nothing| Parameter | Type | Default | Description |
|---|---|---|---|
obj | label or box | required | The label or box whose text is recoloured. |
color | color | required | The new text colour. |
- Returns
nothing- First value
- bar 0
version 1
study("Current reading", overlay = true, precision = 2)

oscillator = rsi(close, 14)
pad        = atr(14)

fn show(value, decimals) => isNone(value) ? "warming up" : text(value, decimals)

var tag = none
if bar.isLast
    caption = "RSI " + show(oscillator, 1)
    plate   = isNone(oscillator) ? gray : (oscillator > 70 ? red : (oscillator < 30 ? lime : silver))
    // White reads on the red and green plates, black on grey and silver.
    ink     = oscillator > 70 or oscillator < 30 ? white : black
    if isNone(tag)
        tag = draw.label(time, high + pad, caption, color = plate, textColor = ink, tooltip = "14 bar RSI")
    else
        draw.setAt(tag, time, high + pad)
        draw.setText(tag, caption)
        draw.setColor(tag, plate)
        draw.setTextColor(tag, ink)
Remarks. rsi() and atr() are computed at the top level and only used inside the if. Called inside it, they would advance only on the newest bar and have no history. While the RSI is still none, the comparisons in ink are none too and take the false branch, so the text is black on the grey plate.
See also. draw.setColor(), draw.setText()
draw.setWidth()
Changes the thickness of a line, of a box's border or of a polyline's stroke. A heavier line says "follow this one", so it is a way to single out the newest object in a list.
draw.setWidth(obj: line, box or polyline, width: number) -> nothing| Parameter | Type | Default | Description |
|---|---|---|---|
obj | line, box or polyline | required | The line, box or polyline to change. |
width | number | required | The new thickness of the line, of the box's border or of the polyline's stroke. |
- Returns
nothing- First value
- bar 0
version 1
study("Latest zone in bold", overlay = true, precision = 2)

var zones = []

if high < high[1] and low > low[1]
    // The previous newest zone goes back to a thin border.
    if size(zones) > 0
        draw.setWidth(element(zones, size(zones) - 1), 1)
    push(zones, draw.box(time[1], high[1], time, low[1], color = orange, width = 3))
    if size(zones) > 10
        draw.delete(shift(zones))
See also. draw.setStyle(), element()
draw.setStyle()
Changes a line to "solid", "dashed" or "dotted". Only a line has a style. A common use is to keep a level solid while it is in play and dash it once it has been reached.
draw.setStyle(obj: line, style: string) -> nothing| Parameter | Type | Default | Description |
|---|---|---|---|
obj | line | required | The line to restyle. Only a line has a style. |
style | string | required | The new line pattern: "solid", "dashed" or "dotted". One of "solid", "dashed", "dotted" |
- Returns
nothing- First value
- bar 0
version 1
study("Target line", overlay = true, precision = 2)

ema20 = ema(close, 20)
band  = atr(14)

var target = none
var goal   = none
var hit    = false

// A new target two ATR above the close on each cross of the average.
if crossUp(close, ema20)
    if not isNone(target)
        draw.delete(target)
    goal   = close + 2 * band
    hit    = false
    target = draw.line(time[1], goal, time, goal, color = lime, extendRight = true)
else if not isNone(target) and not hit and high >= goal
    // Reached: keep it as a record, dashed and stopped at this bar.
    hit = true
    draw.setStyle(target, "dashed")
    draw.setExtend(target, false, false)
    draw.setTo(target, time, goal)
See also. draw.line(), draw.setWidth()
draw.setText()
Changes the caption of a label, or the text written inside a box. Use it to keep a caption in step with the numbers it describes.
draw.setText(obj: label or box, text: string) -> nothing| Parameter | Type | Default | Description |
|---|---|---|---|
obj | label or box | required | The label or box whose caption changes. |
text | string | required | The new caption. |
- Returns
nothing- First value
- bar 0
version 1
study("Session range caption", overlay = true, precision = 2)

// The session's first bar, or of the IST day where no session hours are stated.
newSession = orElse(session.isFirstBar, isNone(time[1]) or not date.isSameDay(time, time[1], "Asia/Kolkata"))

var zone      = none
var startTime = none
var hi        = none
var lo        = none

if newSession
    if not isNone(zone)
        draw.delete(zone)
    startTime = time
    hi        = high
    lo        = low
    zone      = draw.box(time, high, time, low, color = teal, fillColor = teal, opacity = 0.06, textColor = silver)
else if not isNone(zone)
    hi = max(hi, high)
    lo = min(lo, low)
    draw.setBounds(zone, startTime, hi, time, lo)
    draw.setText(zone, "range " + text(hi - lo, 2))
See also. draw.setTooltip(), text(), str.format()
draw.setTooltip()
Sets the detail shown while the pointer rests on a label or box. A tooltip costs nothing on screen, so it is where the numbers behind an object belong, leaving the caption to say what the object is.
draw.setTooltip(obj: label or box, text: string) -> nothing| Parameter | Type | Default | Description |
|---|---|---|---|
obj | label or box | required | The label or box to change. |
text | string | required | The detail shown while the pointer rests on the object. |
- Returns
nothing- First value
- bar 0
version 1
study("Pivot tooltips", overlay = true, precision = 2)

ph = pivotHigh(high, 5, 5)

var tags = []
if not isNone(ph)
    tag = draw.label(time[5], ph, "PH", color = red, textColor = white)
    draw.setTooltip(tag, "Pivot high " + text(ph, 2) + " at " + date.format(time[5], "yyyy-MM-dd HH:mm"))
    push(tags, tag)
    if size(tags) > 20
        draw.delete(shift(tags))
See also. draw.setText(), date.format()
Deleting and counting
draw.delete()
Removes one object from the chart. Any kind of object is accepted. After the call the handle is stale: assign none to the name on the same lines, so no later setter reaches a deleted object.
draw.delete(obj: line, label, box or polyline) -> nothing| Parameter | Type | Default | Description |
|---|---|---|---|
obj | line, label, box or polyline | required | The line, label, box or polyline to remove. none, or an object already deleted, does nothing; assign none to the name on the same lines so no later setter reaches the deleted object. |
- Returns
nothing- First value
- bar 0
version 1
study("Cross marker", overlay = true, precision = 2)

sma50 = sma(close, 50)

var marker = none

if crossUp(close, sma50)
    if not isNone(marker)
        draw.delete(marker)
    marker = draw.label(time, low, "cross", color = lime, textColor = black)

// Remove the marker once price falls back, and forget the handle with it.
if not isNone(marker) and close < sma50
    draw.delete(marker)
    marker = none
Remarks. A setter given a deleted object is error OS4005, which stops the script on that bar and names the bar the object was deleted on. Deleting an object that sits in an array leaves the element in the array; draw.delete(shift(list)) deletes the oldest object and removes it from the list in one line. When removing several elements in a loop, walk the list downwards, for i = size(list) - 1 to 0 step -1, so a removal never skips the element after it.
See also. draw.deleteAll(), shift(), remove()
draw.deleteAll()
Removes every object this script has created. It is a reset: use it when the whole picture is out of date, or on the newest bar in a study that draws only a small set of objects for the current state.
draw.deleteAll() -> nothing- Returns
nothing- First value
- bar 0
version 1
study("Last three pivot highs", overlay = true, precision = 2)

ph = pivotHigh(high, 5, 5)

var pivotTimes  = []
var pivotPrices = []
if not isNone(ph)
    push(pivotTimes, time[5])
    push(pivotPrices, ph)
    if size(pivotTimes) > 3
        shift(pivotTimes)
        shift(pivotPrices)

if bar.isLast
    // A small picture of the current state: clear it and draw it again.
    draw.deleteAll()
    for i = 0 to size(pivotTimes) - 1
        draw.label(element(pivotTimes, i), element(pivotPrices, i), text(element(pivotPrices, i), 2), color = red)
Remarks. Calling it on every bar and redrawing works but wastes effort: it rebuilds every object on every bar of history to show the state of the last one. Every handle the script still holds is stale afterwards, so set the names you keep to none or clear the arrays that hold them.
See also. draw.delete(), draw.count()
draw.count()
The number of objects this script currently holds on the chart. It is the health check for a drawing study: a count that keeps climbing as more history loads is the sign of a create-and-forget object that needs a cap.
draw.count() -> number- Returns
number- First value
- bar 0
version 1
study("Object count", overlay = true, precision = 2)

var zones = []
if high < high[1] and low > low[1]
    push(zones, draw.box(time[1], high[1], time, low[1], fillColor = orange))
    if size(zones) > 25
        draw.delete(shift(zones))

panel = table("Objects", 1, 2, position = "bottomLeft")
if bar.isLast
    cell(panel, 0, 0, "Objects held")
    cell(panel, 0, 1, text(draw.count(), 0), align = "right")
See also. draw.deleteAll(), table()
Related
Lines and boxes, Labels and shapes, Visuals overview, Plotting, Tables, Persistence, Realtime and confirmation, Collections.